
Energy and Electricity Fundamentals - The Base Layer of Our World
Today, energy and electricity go hand in hand as the most important base layers of our world. The energy industry is approximately 6% of world GDP, and our ability to harness energy has directly correlated with our ability to grow as a modern society.
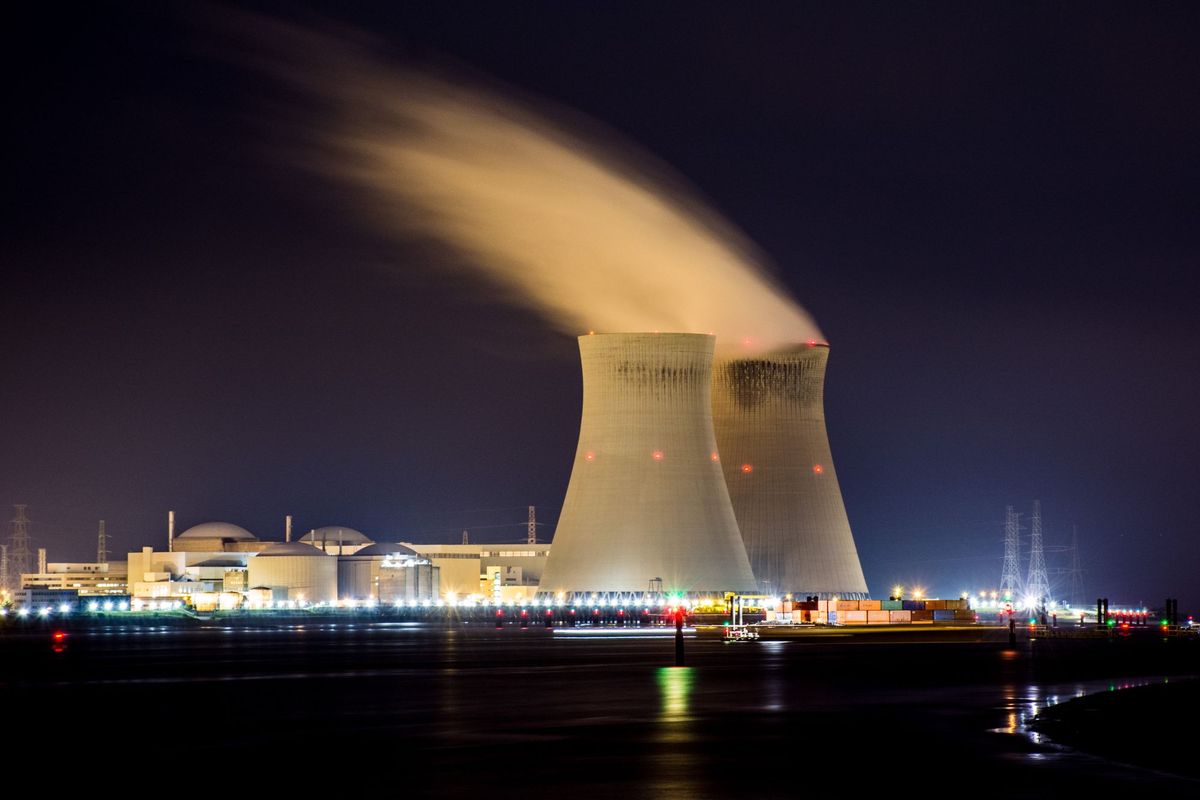
The Three Gorges Dam in China outputs ~100 TWh of electricity every year. It is the largest power plant in both electricity generation capacity and generated output in the world. To give context to just how much energy this is, it is enough to power all household electricity needs for New York City, LA, and Chicago combined.
Embed from Getty ImagesToday, energy and electricity go hand in hand as the most important base layers of our world. The importance of consistent and reliable energy output cannot be understated. The energy industry is approximately 6% of world GDP, and our ability to harness energy has directly correlated with our ability to grow as a modern society as evidenced by the nearly identical rise in world energy consumption and world GDP over the same time period. Even more incredible is that electricity was only first invented ~150 years ago. Of all the thousands of generations of humans who have lived on this planet, only 6 have been alive to see the increased role electricity plays on all things in our society.
- World energy consumption was 173,340 TWh in 2019, a 63% increase from 1990 energy usage.
- World electricity consumption was 25,890 TWh in 2019, a 117% increase from 1990.
- Our world energy needs are dramatically increasing. By 2050, we are expected to consume 39% more energy than we do today.
- Today, 13% of the world population has no access to electricity, and nearly half the world lives below the modern energy minimum.
So what exactly are energy and electricity, and why do we care? How are they measured and created? What are the important trends and macro factors?
In this article we will review energy and electricity from the bottom up, before going into more aggregate statistics, trends, and future predictions. This article is meant as a general guide and journey into energy and electricity to help provide context and framing in our macroeconomic environment.
- Part I (Energy) - What is Energy and why is it important? How is it measured, and what are the types of energy?
- Part II (Electricity) - Why is Electricity Important? How do generation, transmission, and distribution work? What are the important numbers to know and what is the context and relation to energy?
- Part III (Economic Overview) - How much does Energy cost? How much does Electricity Cost? What are the important aggregate statistics?
- Part IV (Key Trends, Takeaways, and the Future) - What is important to know in the future of energy and electricity?
Part I - Energy
Background and History
From our earliest days as humans, we have harnessed energy for our survival and advancement of society. We discovered fire (conversion of chemical energy to thermal energy) ~100,000 BC. As we became an agrarian society ~12,000 BC we leveraged the properties of solar energy for growing and sustaining agriculture. The invention of the steam engine in 1760 AD paved the way for us to convert thermal energy to mechanical energy. And in one of the most fundamentally important inventions of all time, we humans created electricity in 1878 AD, which underpins all of modern society today. Since then we continue to innovate at the atomic level in all forms of energy conversion to electricity (nuclear, solar, etc)
 Kathryn Roberts
Crash Course offers a fantastic insight into these timelines and overview of energy developments:
For thousands of years we operated as an agrarian society, using energy primarily to help with water distribution and construction. The industrial revolution in the 1700s was one of the first major step changes we saw in energy production. Coal became a primary source of energy, and combined with the invention of the steam engine, changed the course of humanity.
Economic historians are in agreement that the onset of the Industrial Revolution is the most important event in the history of humanity since the domestication of animals and plants.
Along with vast other social net positives, during the Industrial Revolution, the percentage of the children born in London who died before the age of five decreased from 74.5% in 1730–1749 to 31.8% in 1810–1829.
Likewise, the next step change occurred with the invention of electricity in the 1880s. And with the advent of gas, oil, nuclear, and solar power we continue to grow our energy production and consumption footprints in society (as seen in the earlier energy consumption and GDP graphs). One last fantastic resource is the full context and history and of energy, presented by Dr. Jim Al-Khalili:
So what are all of these types of energy, and how much of each type do we as humans consume as a society? Before looking at aggregate statistics, we must understand each type, its sources, and the units and conversions.
Types of Energy and Units
Some have quoted "Energy is everything" to Einstein - but at a base level, it serves as a central tenant to the properties of energy. Energy comes in nearly a dozen forms - mechanical, thermal, gravitational, chemical, nuclear, electrical. And while we commonly use the term ‘consume’ energy, the second law of thermodynamics makes it clear that energy cannot be created nor destroyed, but rather it simply changes form. To give examples of this, we refer to the chart and some examples below.
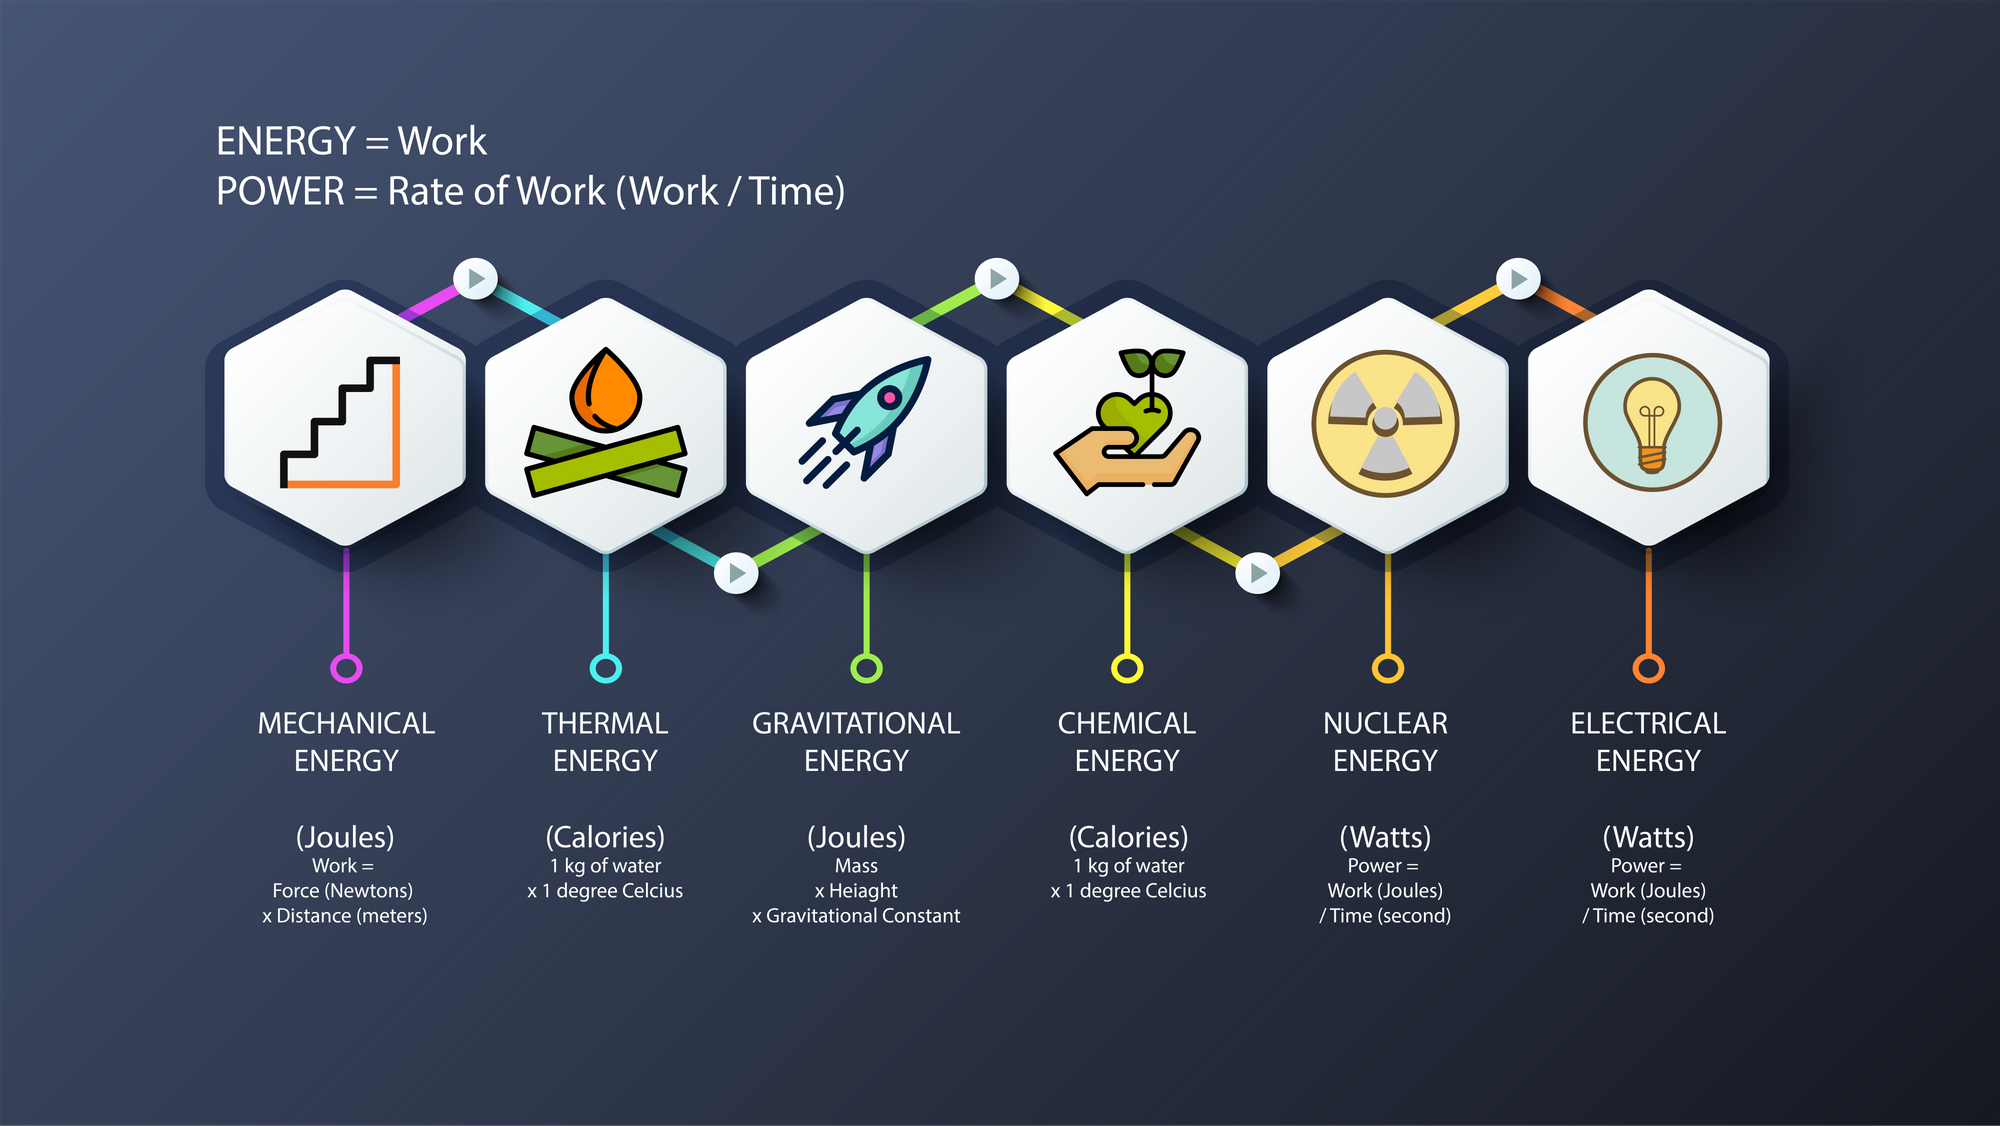
Mechanical energy (energy of movement) may be the most intuitive unit of energy to understand. Energy is defined as work, which is equal to a force exerted over a distance. Force is measured in Newtons, and one Newton is defined as 1 kg⋅m/s^2, which is the force required to accelerate a 1 kilogram object 1 meter per second (per second).
When that force is exerted over a distance, we arrive at Work, which is measured in Joules. One Joule therefore, is the force of lifting one kilogram one meter in one second, or approximately equal to lifting an apple one meter (overcoming the downward acceleration of gravity).
As an example, a person who weighs 220 lbs (100 kg) who climbs a three meter ladder outputs work or energy of ~3000 Joules of work (100kg * ~10/m/s^2 (gravity) * 3m).
Mechanical energy is just one form of this energy. Chemical energy is another type of energy we are familiar with through the food we eat. One Calorie (uppercase) is equivalent to the amount of energy required to heat 1kg of water by 1 degree Celsius. One Calorie is equal to 4,184 Joules. So if we consume a 2500 calorie diet, this is equal to ~10M Joules of energy per day.
Energy has many other units. Examples include the tonne of oil equivalent (toe), which is equal to the energy released from burning one tonne of crude oil, equal to 42 gigajoules. The important thing to note is that due to the laws of thermodynamics and conversion of energy, all types of energy and various units can all be converted to and from one another.
Energy and Power
The next conversion and important concept in understanding energy (and electricity) is Power. Power is the rate at which work is done. One Watt is equal to one Joule of work (energy) done in one second.
- Power (Watts) = Work (Newtons) / Time (seconds)
- Energy (Joules) = Work = Force (Newtons) x Distance (m)
- Force (Newtons) = Mass (kg) * Acceleration (m/s^2)
- 1 Joule is the work required to lift 1 kg 1 meter in 1 second
- 1 Calorie is the work required to heat 1 kg of water by 1 degree Celsius = 4184 Joules
Going back to the earlier example, lifting an apple one meter is One Joule of Energy. Doing it in one second gives a rate of output equal to 1 Watt. A 100kg person climbing 3 meters does 3,000 Joules of work. Doing this work in 15 seconds gives a rate of work at 200 Watts.
Over the course of the day a human can expend an average of 100 Joules of energy per second, which translates to power at a rate of 100 Watts (about the same as a light bulb).
We see this type of unit with common appliances or lightbulbs. A 60 Watt lightbulb consumes energy at a rate of 60 Watts, or 60 Joules per second. And an electric bill may be in units of kilowatt hours (or thousands of watts consumed in an hour). The below diagram outlines some common activities, measures, or contexts for energy consumption.
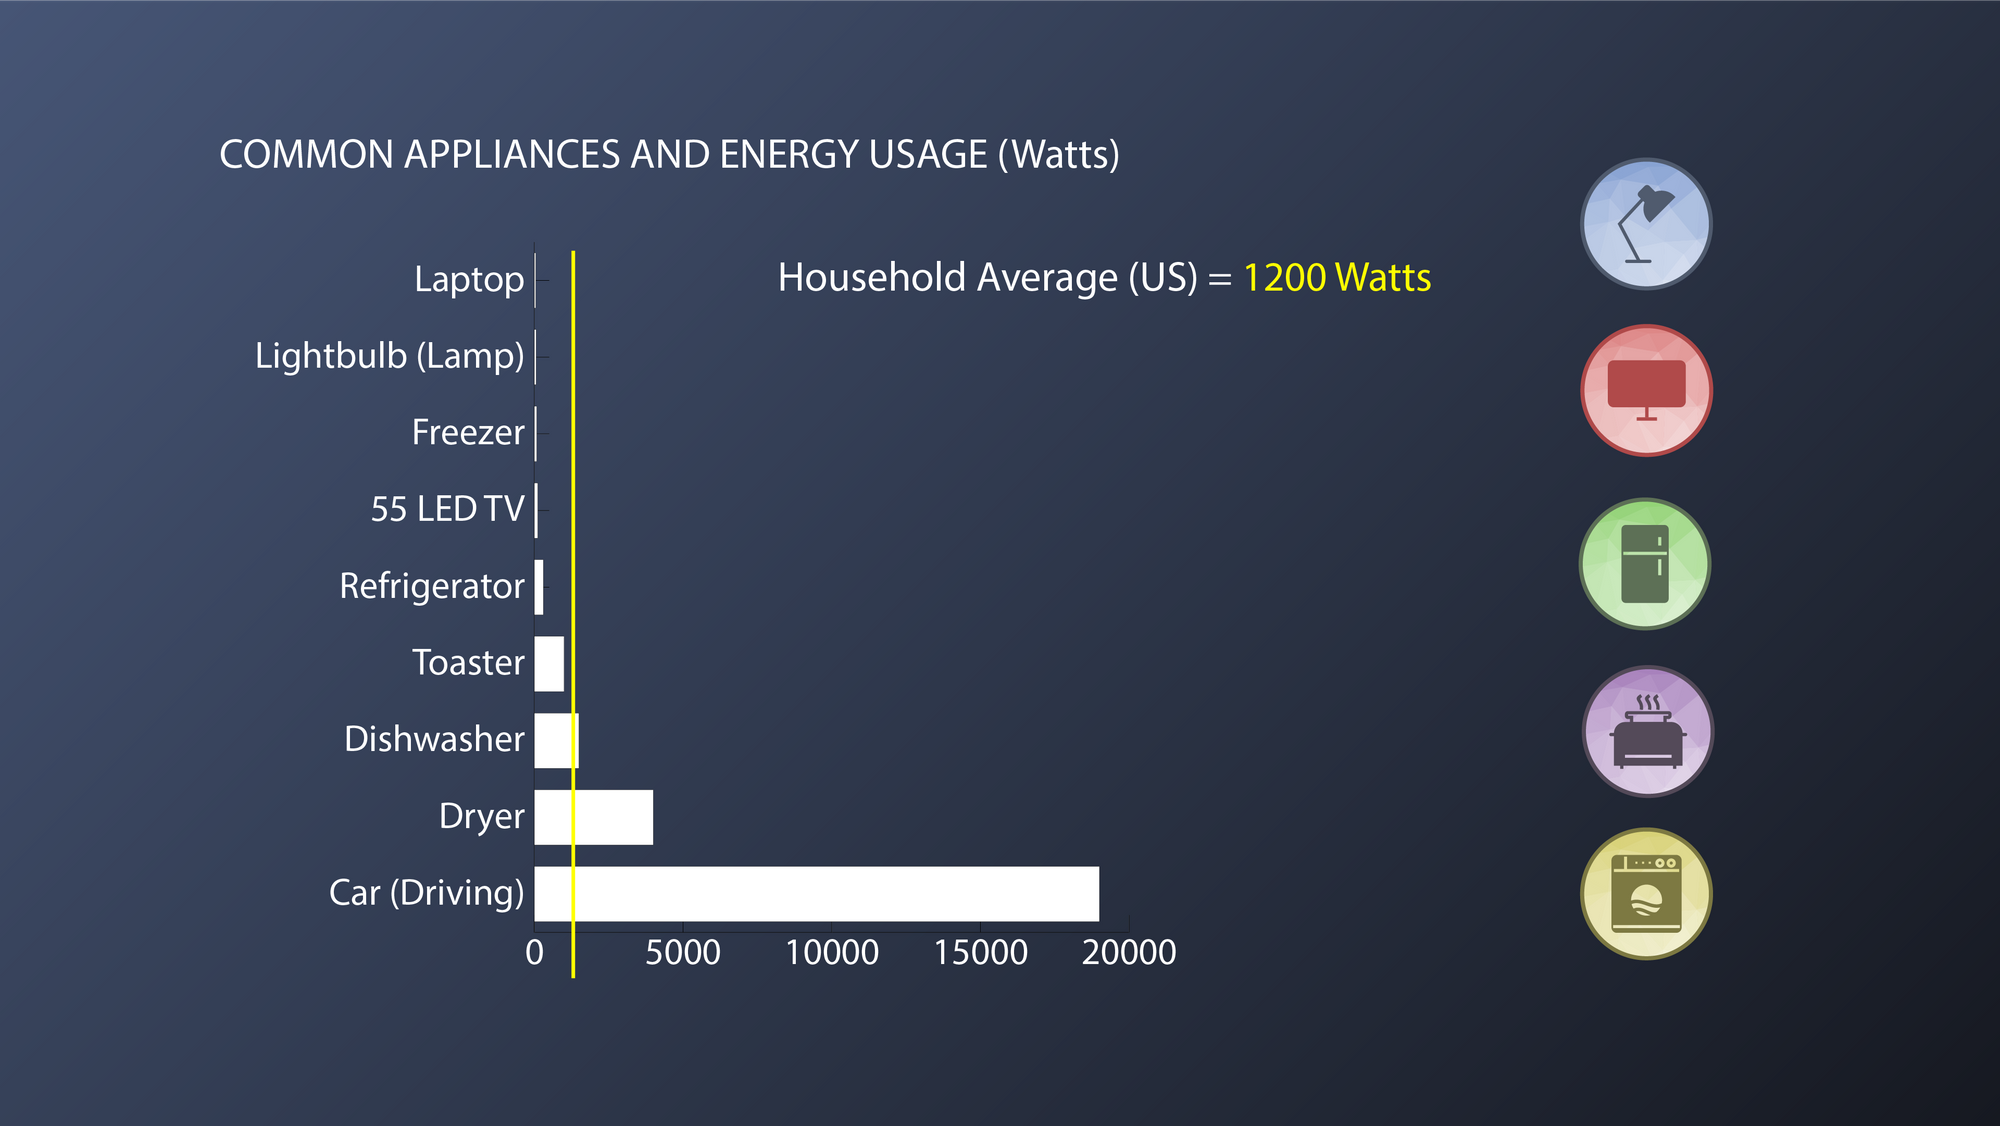
A car, when driving, consumes approximately 19 kW of energy. In the United States, households consume electricity at an average of 1200 W, which results in yearly consumption of 10,715 kWh. Extrapolating on this we arrive at approximately 2.5 TWh of electricity consumed by households in a city of 1 million people (assuming average consumption and 4 people per household).
It is important to distinguish between energy and electricity. Electricity (covered in more detail shortly) is a subset and just one component of all energy. Of all energy consumed, electricity is approximately 15%. The other two primary energy uses are in heating and transportation (85%).
Our World In Data has the most comprehensive data and analysis of energy and electricity, with much of their data coming from BP's annual report. We can look at at their numbers and graphs to help contextualize energy and its sources:
Total World Energy Consumption in 2019 was 173,340 TWh.
Per person per year (per capita), this translates to 22,600 kWh.
Of this, approximately, 15% of energy produced is consumed to create electricity (the remainder for heating and transport). Total World Electricity Consumption in 2019 was 25,890 TWh. Per capita, this breaks out to 3,375 kWh.
Part II - Electricity
Background & History
Electricity is just one component of energy, and in many ways it can be though of as a man-made second order application of energy. The first industrial revolution led to unprecedented gains in manufacturing and output. But in the 1880's, when Edison invented the lightbulb, we had a second industrial revolution, and electrification was thy key factor for everything. The full history of electricity is fascinating, and there is no better resource than Dr. Jim Al-Khalili who tells the history of innovation and context in this epic three hour production - from the early ‘magic’ of static electricity, to the invention of the lightbulb, to the ‘current wars’ of Edison, Tesla, and Westinghouse and the first distribution.
Measuring Electricity
Just like other forms of energy, electricity is measured in Watts (or Watt hours for a total output over time). Electricity in Watts is the product of Voltage (the ‘pressure’ of the current) times Amperage (the total amount of current). One Amp is equal to one Coulomb going past a point in one second. A single Coulomb is the base unit of charge and represents 6.2415 x 10^18 electrons.
Notice again the output measured is Watts (Power), which is easily converted to Joules and other sources of Power (like the conversion of energy sources).
- Voltage = The "pressure" of the electricity
- Ampere = The "amount of current" (the flow of electrons past a point)
- Watts = Voltage x Amperage (pressure x current)
Electricity Generation
So how do we create this pressure and current? Electromagnetic or magnetic induction is the production of an electromotive force across an electrical conductor in a changing magnetic field. Michael Faraday is generally credited with the discovery of induction in 1831, and James Clerk Maxwell mathematically described it as Faraday's law of induction.
At a basic level, Faraday discovered that when a magnet is moved relative to a conductor, an electromagnetic force is created. This discovery underpins how all modern generators work. The power needed to rotate the magnet is equal to the input power (mechanical energy), with extra energy required to offset friction and heat loss (again energy is only converted in form).
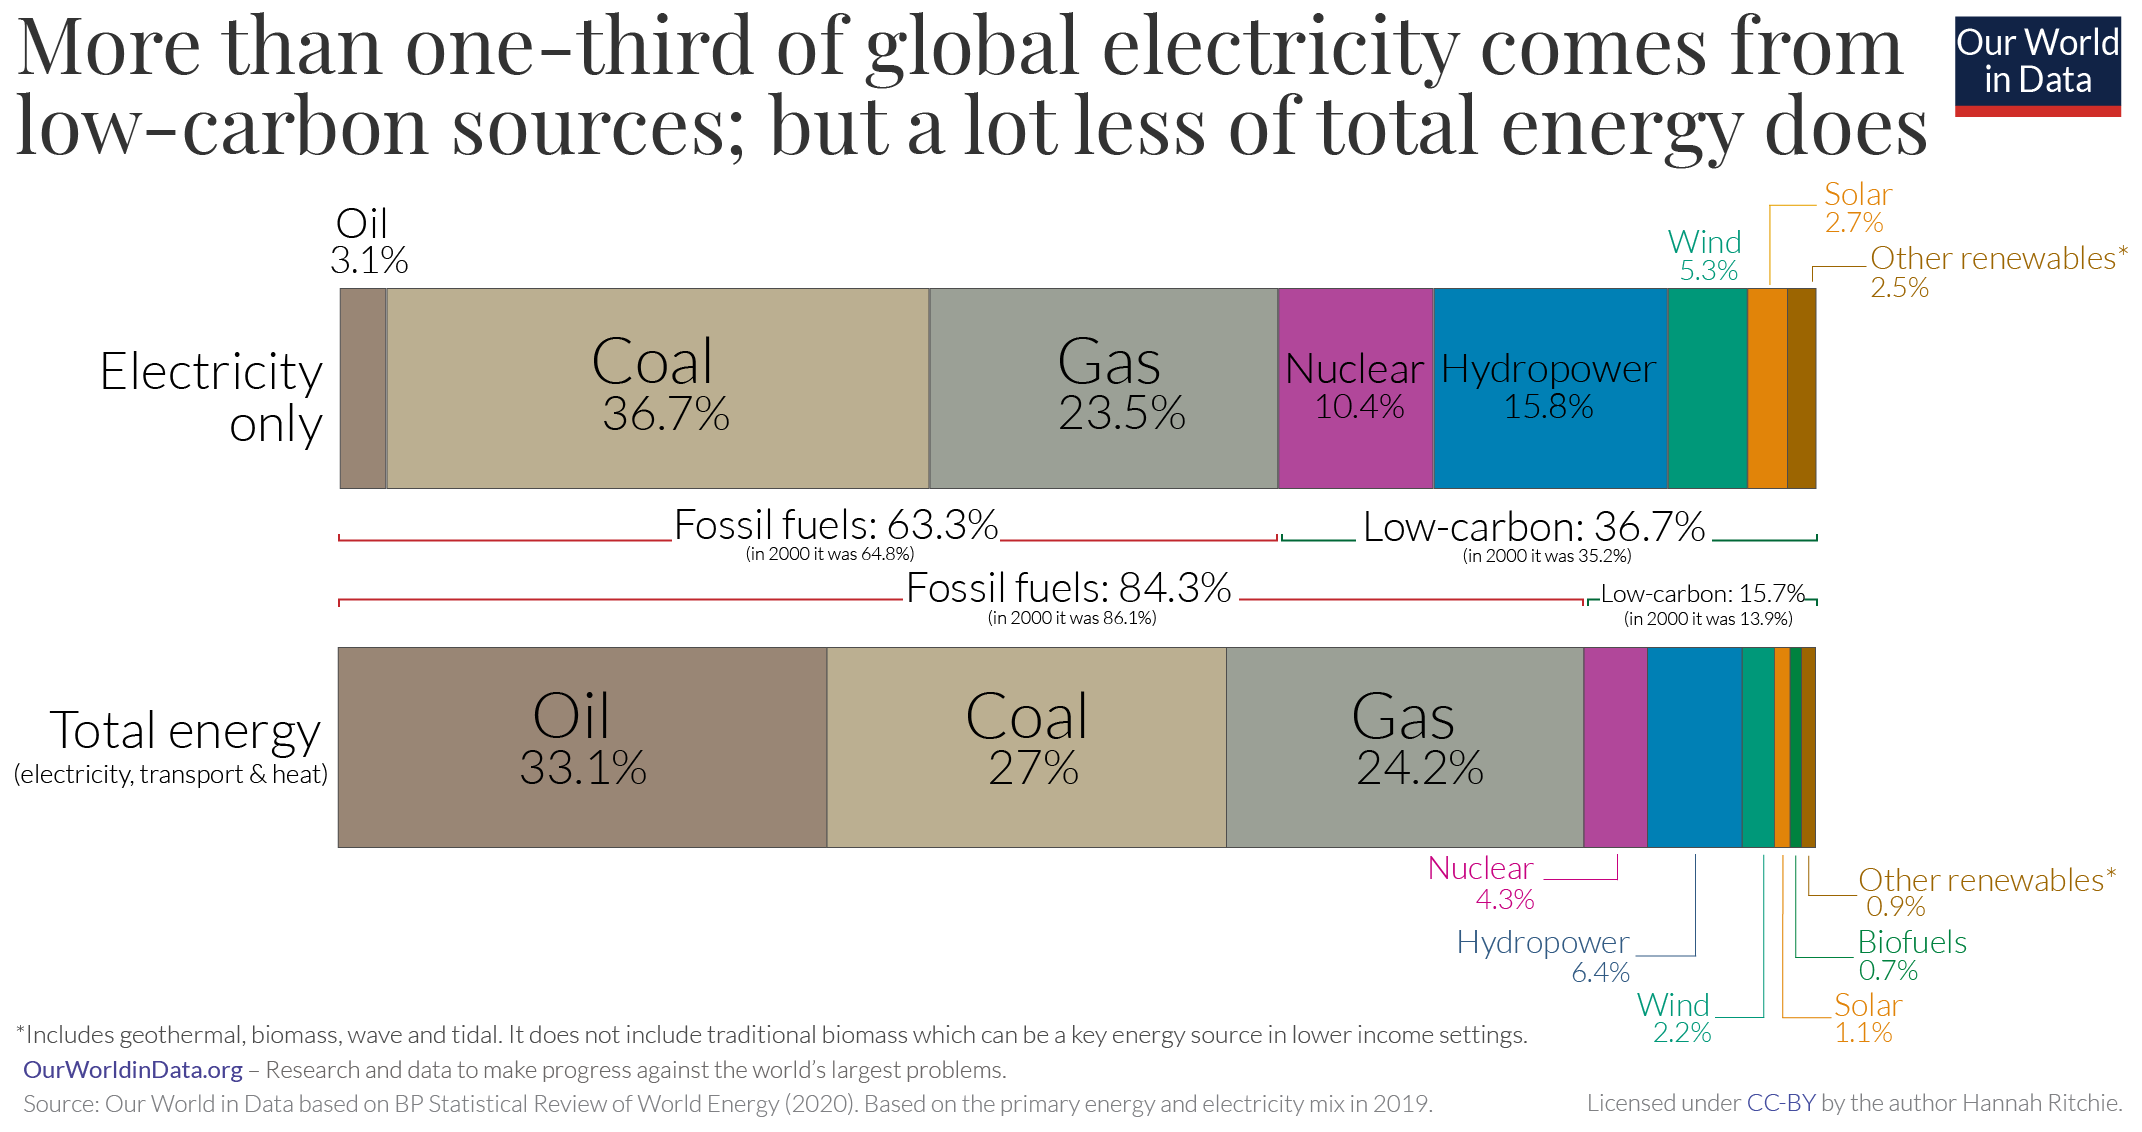
Electricity is created with magnetic induction, and spinning a magnet will create a current. This ‘spinning of a magnet’ is how nearly all electricity is generated. The only difference is how the energy to spin this magnet is derived. This is where the various power electrical generation sources come into play. Breaking down a few of the common generation forms and their share of total electricity production (note that these totals and percentages use the substitution method):
- Coal (36.7%) - coal is burned to heat water, which creates steam presure, which is used to rotate a generator
- Gas (23.5%) - gas is burned to create combustion, and the mechnical energy rotates a generator
- Hydro (15.8%) - flowing water rotates a generator
- Nuclear (10.4%) - uranium atoms are split, releasing heat, which is used to boil water, release steam, and rotate a generator
- Wind (5.3%) - wind rotates a generator
The sources of electricity generation are also important in matching demand. Electricity is consumed nearly the moment it is created. There are no requirements to let anyone know that a device will be ‘turned on’. So it is important for grid operators and utilities to constantly match demand and supply. This is done through a process known as load following. The best resource is here:
Grid operators must be able to rely on constant energy creation, known as base load. Typical base load can be delivered by Coal, Nuclear, or Hydro plants. These plants will operate at full capacity, as in many cases they can take hours or days to start and ramp up to full capacity. With planning and insight to aggregate demand, trends, and predictions, utilities will also leverage and plan for additional sources to come online with intermediate load, and peak load.
Traditionally this has been one of the major drawbacks for sources like solar or wind, which are not predictable and cannot be used for any type of base load. However, as costs decline and improvements are made with software and battery capacity, these sources may become more effective. Elon Musk and Tesla also have very interesting work in flight with the Tesla Virtual Powerplant and the idea of load balancing battery power found in all Tesla Powerwalls (or cars).
Electricity Transmission and Distribution
For any of this electricity to serve a purpose, it must be delivered to consumers in a reliable fashion. Enter the incredible world of ‘The Grid’ and electricity transmission and distribution. Electricity is generated at power plants, that for good reason, are typically far from city centers or the end destination. To transmit electricity hundreds of miles to its various destinations, electricity is stepped up (voltage increased) for most of the journey as it is most efficient. And then local substations and eventually transformers step down the voltage so that it arrives in our homes ready for use with our outlets.
Who are all of the players in this network? In the United States alone, there are 3 main grids, more than 600,00 miles of grids, and more than 3,000 utilities that generate, transmit, and distribute power across the country.

~72% of electricity is generated and transmitted through what are known as Investor Owned Utilities. These IOUs are publicly traded, and operate as any other public company. They raise money through debt and equity, from public investors and government to build and operate new powerplants and infrastructure. Each type of plant has different economics, and these IOUs will look at cashflows, payback periods, and negotiate electricity rates with consumers (through various orgs) as they evaluate and engage in new construction, generation, and operation. Examples of these companies and their operations can be seen in 10Ks of companies like Duke Energy and Pacific Gas and Energy.
Part III - The Economic Overview
Now that we have gone through what electricity is, how it is generated, and how it is managed through transmission and distribution, we can better investigate macro statistics, economics, and trends.
How much does energy cost?
Energy costs fluctuate regularly due to a large number of factors - supply, demand, geopolitical factors, OPEC - all cause large fluctuations in price.
- Barrel of Oil = ~$40 = 1.7 MWh per Barrel = $23.53/MWh
- Ton of Coal = ~$233 = 6.2 MWh per Ton = $37.67/MWh
Note that Coal prices have increased 300% in 2021 alone
How much does electricity cost? What are the historical cost trends?
One of the best metrics for determining costs of electricity is to include all the NPV of total costs (capex and opex) divided by the NPV of the electricity produced over the same time period. This Levelized Cost of Electricity (LCOE) is analyzed in detail by Lazard below - the figures are cost per MWh in 2018 and the increase/decrease in that same price from 2009.
- Gas Peak (-35%) $179/MWh
- Nuclear (+23%) $151/MWh
- Coal (-9%) $102/MWh
- Wind (-69%) $42/MWh
- Solar (-88%) $43/MWh
How much does world energy cost? What is the relation to GDP?
World energy costs are hard to calculate, but some back of the napkin math (multiplying the Coal consumption in TWh x price of coal per TWh, the Oil consumption by price of oil, and assuming the average of those costs for the other sources) gives world energy costs of ~$5.2 Trillion. This is approximately 6% of the 2019 world GDP of $87 Trillion.
How distributed is electricity consumption?
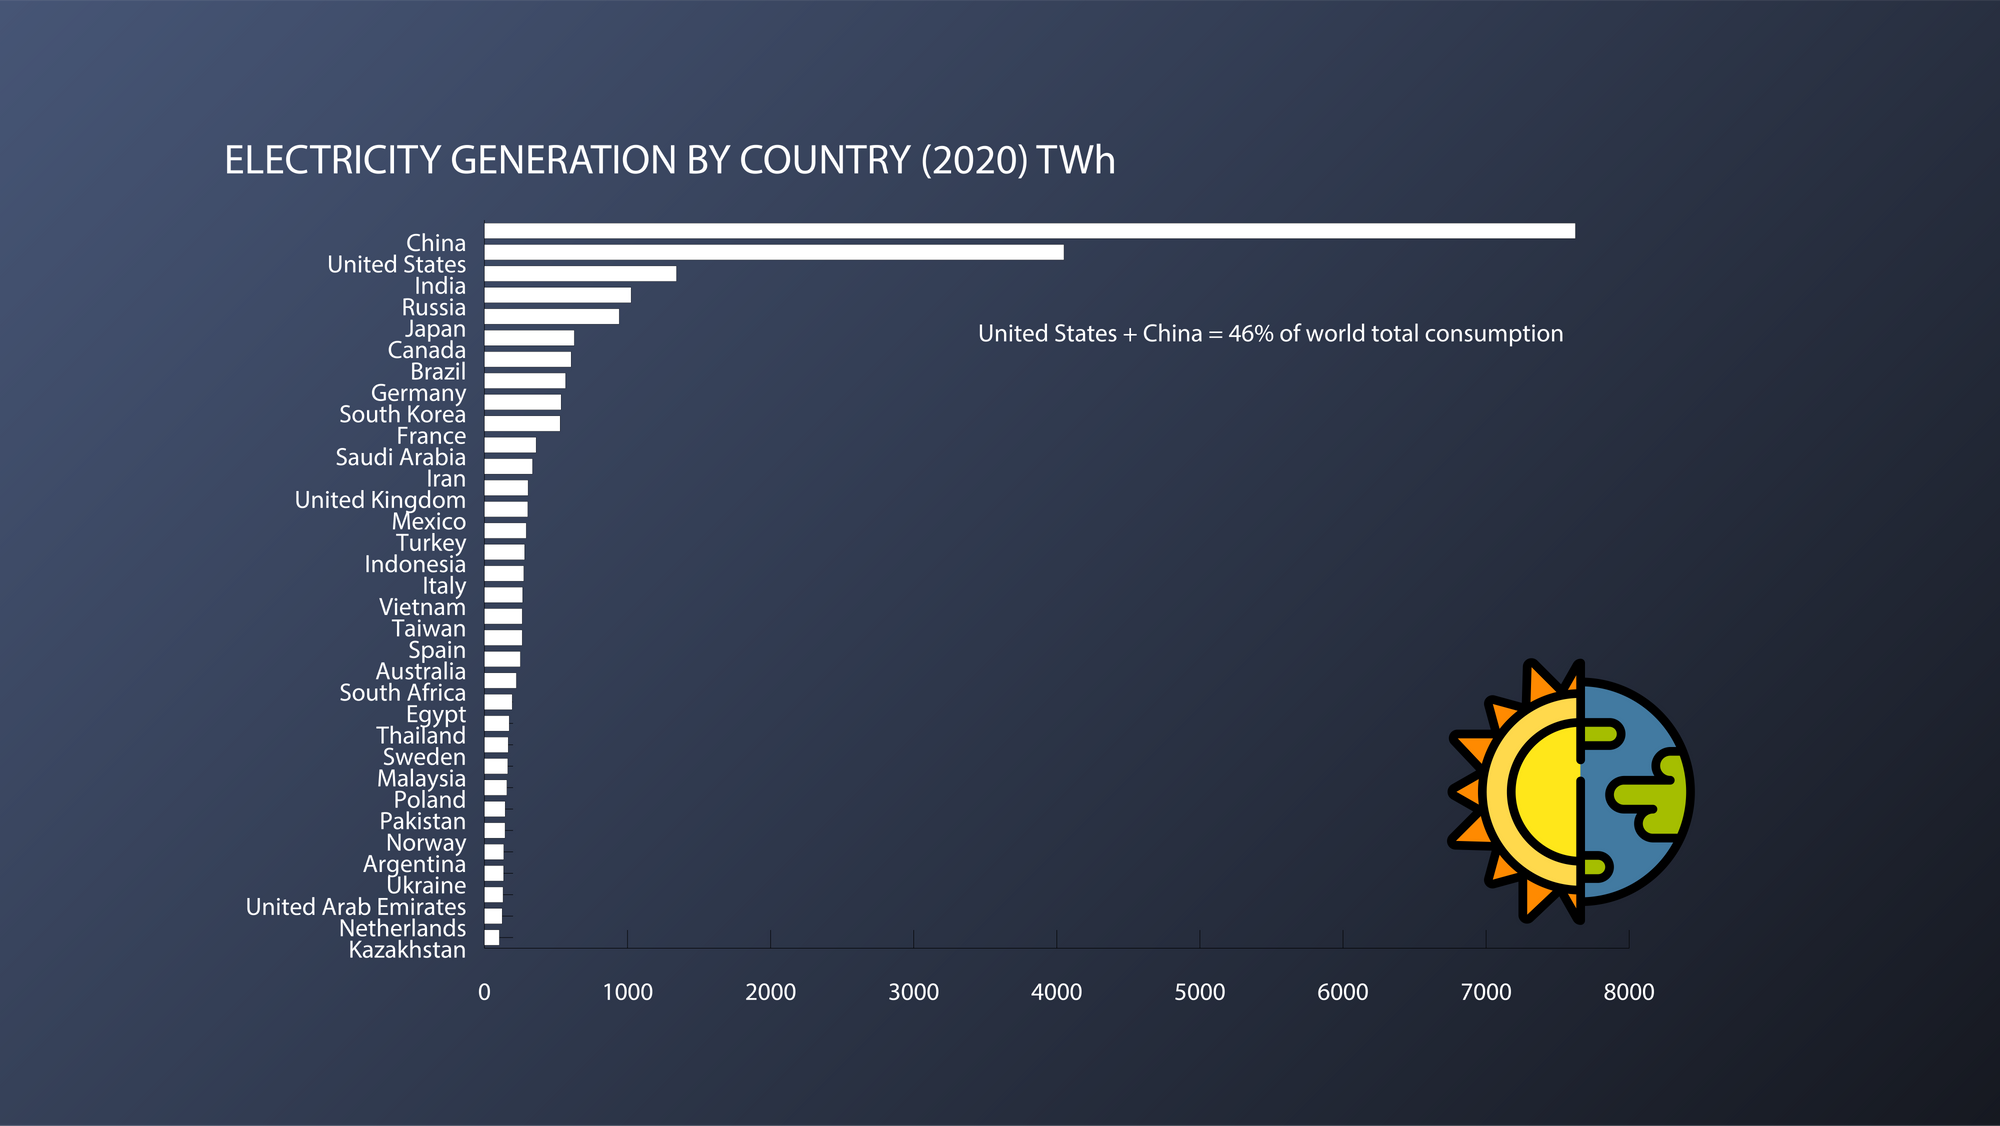
On a total consumption basis, China and the United States make up 46% of the world total. On a per capita basis, Iceland leads all nations with nearly 57,000 KWh per person.
How is the energy sector valued?
The energy sector is extremely complex, with many inputs, variables, and valuation metrics. For some basic numbers, the Oil and Gas industry has a P/E ratio of ~21 for US companies. The Utilities sector has a P/E of ~26 with typically larger than average dividends. Both sectors trade below the ~35 P/E ration of the S&P 500.
Part IV - Key Trends, Takeaways, and the Future
Increased Energy and Electricity production (and consumption) is good for society
Access to energy and electricity is strongly correlated with advancements and improvements for society. This has been seen since the first industrial revolution.
In developing nations (13% of the world has no access to electricity), lack of energy and electricity correlates directly with a lower GDP.
- Villages with electricity had a 31% higher literacy rate among females. Electrification of a village reduced poverty by 13%.
- 8 of the top 10 countries for child marriage (marriage of girls before 18) do not have enough electricity consumption per capita to be listed by the world bank.
- The effects of energy use on infant mortality rates in Africa, showed a 1% point increase in energy consumption implies a decrease in under-5 mortality rates of 26%.
One of the most beneficial things for developing countries is sustainable and consistent energy and electrification.
Energy and Electricity Demands Are Growing
Right now, nearly half of the world's population lives below the Energy for Growth Hub's Modern Energy Minimum. The below paragraphs are copied directly from BP's 2021 Annual Statistical Review of World Energy, from Spencer Dale, BP's Chief Economist.
"The number of people without access to electricity has fallen from close to 1 billion in 2015, to a little over 750 million by 2019 – around 10% of the world’s population, down from 15% in 2015. Encouraging progress. However, just as with emissions, the progress comes with caveats. The improvements have been uneven, with three-quarters of the global population without access to electricity situated in sub-Saharan Africa...
Moreover, the impact of COVID-19 has reversed some of that progress. The World Bank estimates that the pandemic has made basic electricity services unaffordable for 30 million more people, the first time the number of people without access to electricity has increased for six years. And access to clean cooking facilities – the other focus of SDG 7 – lags far behind with around 2.6 billion people estimated not to have access.
Moreover, the concept of ‘energy access’ is somewhat nebulous. The UN defines access to electricity in terms of a minimum level of residential consumption. But the level of energy needed to support strong, sustainable economic growth is likely to far exceed that. Energy is vital for productive uses as well as household consumption.
For example, the Energy for Growth Hub propose a Modern Energy Minimum of 1000 kWh per person per year, which they argue is consistent with countries reaching a lower-middle income status. This is around four times greater than the UN definition...
Importantly, the Energy for Growth Hub estimates that more than 3.5 billion people – close to half the world’s population – are living below the Modern Energy Minimum.
Half the world’s population – it makes you think"
With half of the world below energy and electricity targets, we will need significant production (and investment) to ensure we continue to raise the standard of living in the world.
- Final energy consumption is expected to increase by about 15% from 2019 levels by 2030 and by about 39% by 2050, at an average annual rate of approximately 1%.
- Electricity consumption is expected to grow at a faster rate of about 2% per year. Electricity consumption is expected to almost double by 2050.
- By 2050 the share of electricity in final energy consumption is expected to increase by about 8 percentage points from its 2019 share.
Energy consumption grew by 63% from 1990 consumption to 2019 consumption. In this same 30 year period moving forward, we expect increased demand of 39%. This would put total world demand for energy at ~241,000 TWh, an increase of ~68,000 TWh over 2019 levels.
Furthermore, electricity's share of total energy demand will reach approximately ~23% in 2050.
To Ensure We Meet Carbon Reduction Targets, We Need Increased Investment in Nuclear, Grid Infrastructure, Battery Technology, and Renewables
The growth in demand for energy (which we have seen is good in so many cases), requires us to be cognizant of our increasing carbon footprint.
The Institute for Energy Economics and Financial Analysis predicts that Solar Power could reach 25% share of global power production in 2050. This would put solar output at nearly ~60,000 TWh, which represents more than a 30x increase from the 2019 output of 1,793 TWh.
This increase in solar marks a massive increase towards ensuring a Carbon neutral future. However this will also require massive increases in:
- Technology for Grid Transmission (allowing homeowners and businesses to put excess electricity back to the grid)
- Improved Batter storage technology - one limiting factor of solar is that it can not serve as a Base Load electricity (as the sun can go away). Battery Storage and new load balancing techniques like the Virtual Power Plant from Tesla will help make Solar Feasible.
But even if we see these massive gains in solar play out into 2050, we will still require as much energy as we do today (~241,000 TWh global demand minus ~60,000 TWh of Solar leaves us with 180,000 TWh to generate in 2050 (which is more than all of today's energy demand!).
To keep pace with our demand, and begin to offset sources of coal, gas, and oil, especially in electricity (which is easier to generate from renewables), we will need to ensure that Nuclear remains an absolute priority for all nations. This is the only way the numbers add up in making strides for a more carbon free future.
Conclusion
This article was meant to give a basic background into one of the most important parts and 'layers' of our global society. Be sure to subscribe to the newsletter and YouTube channel for more future content like this. Thanks for reading.
Comments ()