$AMZN - a Buy in 2022? Price Target, Models, and More
It has been a rough start to 2022 so far for Amazon and many of the other major tech stocks. After a whopping 73% gain in 2020, Amazon was relatively flat in 2021 while the S&P saw a 27% gain during the same period. What lies ahead for Amazon this year (2022)?

It has been a rough start to 2022 so far for Amazon and many of the other major tech stocks. After a whopping 73% gain in 2020, Amazon was relatively flat in 2021 while the S&P saw a 27% gain during the same period. What lies ahead for Amazon this year (2022)?
In this article we’ll break down Amazon at a high level, review its reporting segments and some revenue drivers, look at future areas of growth and revenue, and pull everything together to make a price prediction for the stock in 2022.
The models linked here have full data, projections, analysis, and sources for much of the material covered throughout this article:
The YouTube video linked above offers a walkthrough by segment.
How does Amazon make money?
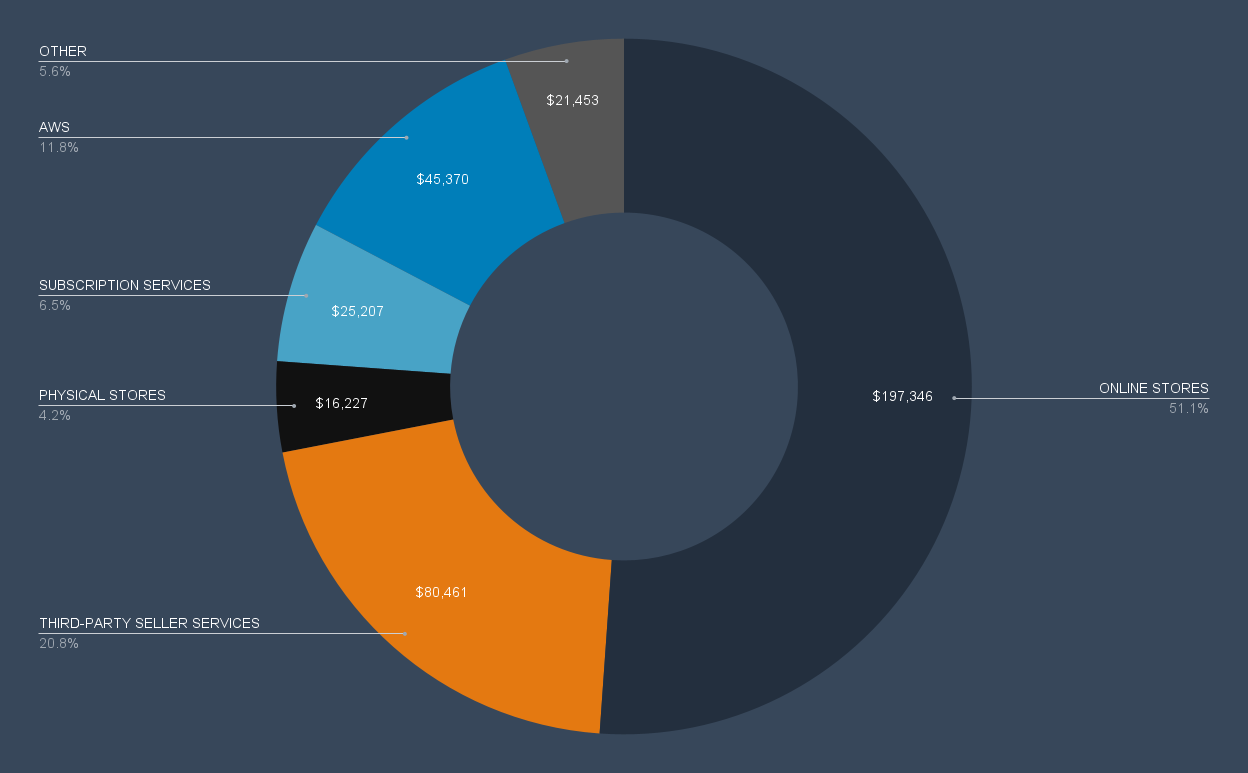
Amazon made $386 Billion in 2020 and is on track to do approximately $470 billion in 2021. It reports revenue through six segments - Online Stores, Physical Stores, Third Party Seller Services, Subscription Services, AWS, and Other.
Online Stores made up just over 50% of the total, with third party seller services adding another 21% (or $80 Billion to the total).

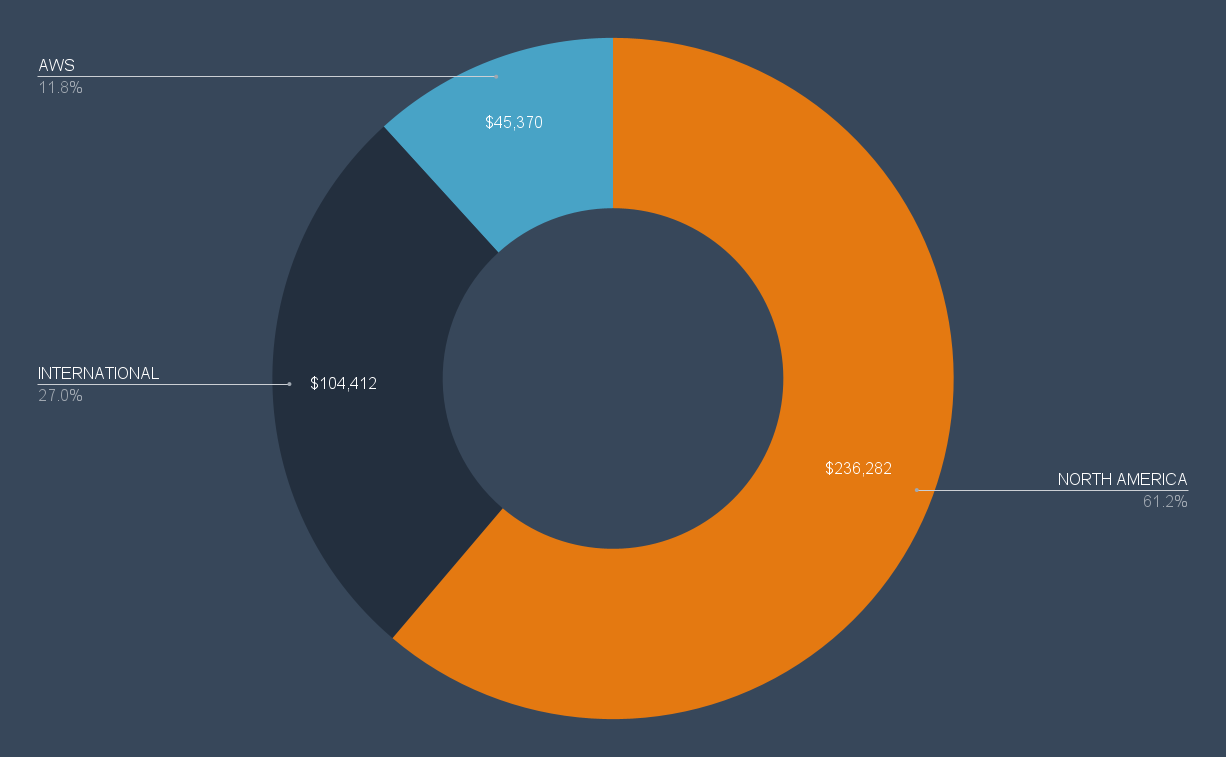
Amazon also breaks out Revenue (and expenses) between North America, International, and AWS, with 61% of revenue coming from North America. Amazon Web Services (AWS) accounted for 12% of revenue in 2020, but made up nearly 60% of operating income.

To guide a price target for 2022, we’ll go into detail on each of these segments.
Online Stores & Third Party Seller Services
We all know Amazon sells things online. But how exactly does this work? When you click that Place Your Order button, how does Amazon record revenue? First party sales are those which Amazon manages - and you’ll see a “sold by Amazon” for any private label brands. Examples of first party sales would be Good Threads clothing, Rivet Furniture, or any of the Echo products.
The other way goods are sold on Amazon is from third parties. In this case, sellers register with Amazon and are given a full suite of tools and platforms to manage their listings. Sellers can choose to manage the fulfillment process on their own after a website sale or they can have Amazon deliver goods, sending all of their goods to Amazon ahead of time - in what is known as Fulfilled by Amazon (FBA).
In both of these third party cases, Amazon does not record any gross revenue. If a third party sells a TV for $500, Amazon will only record revenue for the fees it receives as part of its seller agreement - which includes a commission rate and other selling fees (which vary by items sold).
These third party commissions, fulfillment, and listing fees make up the Third Party Seller Services segment for Amazon.
Over the past three years, both the Online Sales and Third Party Seller Services segments have seen explosive revenue growth, at a CAGR of 22% and 36% respectively. So the big question now is what kind of growth can we anticipate in the future?
# Customers x Purchase Frequency x Average Purchase Amount (# Items x Average Item Price) + (Amazon’s share of 3P Sales)
To maintain this growth, at least some of the variables here will have to increase, and we’ll look at this drivers for this formula through three lenses (Macro, Ecommerce, and Amazon Specific)
Macro Drivers
At a high level, Amazon benefits from continued global internet adoption, especially as they expand internationally. 46% of the world used the internet in the last three months, and this number only continues to grow.
In the United States, adults spend more than 6 hours a day with digital media - as of 2018 - a figure that has grown every year
Ecommerce Drivers
Total US Retail Sales in 2020 were $3.6 Trillion, excluding gas, auto, and restaurants sales (excluded because it is doubtful Amazon will enter these markets), and grew nearly 6% from 2019 totals.
Total US Ecommerce sales were $762 billion in 2020 and have grown at a much faster pace - the pandemic helped increase online sales by 32% from 2019 totals.
One prevalent measure in Ecommerce is Gross Merchandising Volume (GMV) which refers to the final value of all goods sold on a platform. Amazon does not break this number out specifically and because all third party seller sales are booked as revenue on commission only, the final value of goods sold on their platform is considerably higher than what they report in revenue across online sales and third party seller services.
Estimates of Amazon total GMV in 2020 are $475 Billion. This means that Amazon’s US sales made up 8.6% of total US retail sales and nearly 41% of all US ecommerce sales (which are also in line with internet estimates). So how much more can they grow?
If Amazon compounds online sales at 13% yearly and third party seller services at 17%, this puts their US GMV at $800 billion in five years which would represent nearly 18% of all US retail sales and over 50% of US ecommerce sales - assuming those figures also grow at similar historical rates. Already Amazon is expected to surpass Walmart in GMV, which had approximately $370 Billion in US GMV in 2020.
Internationally, the market for growth is massive with global ecommerce sales at $4.2 trillion - and Amazon is making large strategic investments to continue their international growth (which historically has accounted for about 35% of their total retail sales).
Amazon Specific Drivers & Innovation
Let’s take a look at some Amazon specifics. By now we all recognize the value that Amazon offers already in ECommerce. If you’ve ever waited in a long checkout line, wandered aimlessly through the store trying to find a specific item, or spent hours in your car to run errands, you can certainly appreciate the value Amazon provides. In his most recent shareholder letter, Jeff Bezos breaks down the stats and estimates that Amazon can save the average consumer 75 hours per year. And the pandemic of the last two years has only accelerated the move to ecommerce.
Amazon spends a massive amount of money - some $20+ billion - on R&D related activities. While some of that accrues more specifically to AWS or other parts of the company, Amazon continues to relentlessly innovate.
Amazon Alexa: and its associated applications, while sold at cost or even as a loss leader, offers one more funnel into engaging customers and adding to its ecommerce suite (and provides endless AI training for when the robots take over and talk to us). More than 100 million devices are connected to Alexa.
Last Mile and Shipping: Amazon continues to accelerate shipping time for customers. Amazon shipped an estimated 21% of all packages in the US in 2020. Their estimated 4.2 billion package deliveries surpassed FedEx’s 3.2 billion. Amazon is rolling out and experimenting with drone delivery, street robots, and they continue building fulfillment centers around the world - all bringing more customers into the 2 hour delivery window and reducing overall shipping time. By 2026, Amazon could be shipping more than 10 billion packages per year.
Third Party Sellers: The number of third party sellers grew 16% to nearly 6 million in 2020. As Amazon rolls out additional training, features, and becomes the all-in-one platform for growing an ecommerce business, we will look for the number of sellers to increase by some 15% a year to support revenue projections.
Data and Recommendations: the pool of data on all of our shopping habits is staggering. You may have noticed that Amazon doesn't include the items you purchased in order confirmation emails anymore, because they don’t want Google scraping this data from gmail accounts. Between all of the enhancements in AI and the personal data profiles Amazon has, they may be in the best position in the world to understand the macro-economy and customer shopping habits - in fact they may be a bit too good at it, and have been called out recently for using third party seller data to create their own private label products.
The Flywheel - Nearly everything Amazon does helps its online presence, which drives more customers and more engagement - which leads to higher online sales. From physical stores, to grocery pickup, to streaming video, music, and games - more time on Amazon equates to higher sales and Amazon is becoming the largest Platform-as-a-Service but for all things physical goods
Getting back to stock price predictions, we’ll take all of these factors as top down drivers to set 5 year compound growth rate for online Stores at 13%, which puts 2026 projected revenue at $419 Billion.
For Third Party Seller Services, we’ll estimate 5 year compound growth rate at 17%, which puts 2026 projected revenue at $228 Billion.
Physical Stores
Physical Stores made up 4% of Amazon revenue in 2020. Amazon operates Whole Foods (acquired in 2017) and operates approximately 24 Amazon Book stores, 19 4 Star stores, and 30 Amazon Go Stores - all of these adding just one more point of presence to feed the online flywheel and ecosystem. With Whole Foods, Amazon has secured its physical retail presence with more than 500 stores, and gives it a wedge into the $1.5 trillion a year US grocery industry.
Amazon Go’s checkout technology that doesn’t require a human cashier could offer a game changer as Amazon partners with companies like Starbucks, rolls it out to Whole Foods nationwide, or licenses the technology to other grocers or retailers.
None of this is modeled out now, so it is pure upside, and for modeling purposes, we’ll keep physical store revenue growth relatively stable at a 3% a year over the next 5 years.
Subscription Services
Subscription Services refers to Prime membership fees and other digital goods sales - things like movies, audiobooks, ebooks, and music. In 2020, total revenue in this segment was $25 billion, making up 6% of total revenue.
215 million Americans visit Amazon every month, and 65% of customers are Prime Members. Prime Memberships have a long list of benefits, and Jeff Bezos is quoted as saying he hopes to make Prime "such a good value, you'd be irresponsible not to be a member."
There are an estimated 200 million prime members around the world, a figure that has doubled since 2018. The revenue drivers in this category again go back to the flywheel Amazon has in place - more people on the internet, more people engaging with ecommerce, and more people getting greater value from Amazon.
Amazon’s international growth will continue to become a focal point as they tap out the upper end of the market in the US. A Compound Annual Revenue Growth Rate of 12% over the next 5 years would put subscription services at $56 Billion and represent nearly 400 million Prime Memberships by 2027.
Amazon Web Services (AWS)
AWS is an absolute beast. In 2020, it brought in $45 Billion and made up 60% of Amazon’s operating income. Even at this scale it has been growing more than 35% each year and shows no signs of slowing down. Cloud computing is becoming one of the most important base layers of our world - and continues to grow exponentially. It is such a broad and important topic, and we’ll do an in-depth separate video breakdown next week - so be sure to hit the subscribe button below.
At a brief macro level - AWS has enormous tailwinds that help ensure their future growth:
- Data Volume is expected to grow at a CAGR of 27% for the next five years, putting total data created at 222 zetabytes in 2026.
- The number of workloads running in the cloud is expected to grow from 42% to 54% over the next 5 years.
- And nearly every company has made digital transformation a top initiative (if they haven’t already). AWS controls some 30% of the cloud computing market and are well positioned to continue their rapid growth.
For purposes of stock price targets, we’ll model out growth of 25% annually over the next five years with a similar margin structure to what they currently have, which puts 2026 revenue at $177 Billion. AWS deserves a deeper dive with bottom up analysis and Amazon specifics - so smash that subscribe button and turn on notifications for next week’s video.
Other (Advertising)
According to Amazon the ‘Other’ Segment “Primarily includes sales of advertising services, as well as sales related to our other service offerings.” All of those advertised listings that third party sellers pay for are paying off for Amazon. In 2020, the ‘Other’ segment reported revenue of $21 Billion - a steep increase from just $5 Billion three years prior.
The margins on this advertising segment are incredibly lucrative, and with Amazon’s flywheel - more customers, more products, and more time in the Amazon ecosystems - these sponsored search results command a premium.
For comparison’s sake, Facebook advertising revenue in 2020 was $84 Billion and Google’s was $147 Billion - so there is plenty of room for Amazon to grow in this segment. It may need to be careful though as already questions of monopolistic practices have come up with some of its private label goods, and a ‘pay to play’ strategy may hinder some of the growth in its third party seller services segments.
For purposes of helping model a 2022 price target, we’ll model segment revenue growth at 20% yearly, making the Other segment an $80 Billion a year business by 2027.
Future Revenue Drivers & Markets?
All of this analysis so far is primarily based on historical trends, current operating segments, and future macro trends. One big question to answer will be can Amazon create new revenue streams?
- Amazon Go technology could significantly disrupt retail and chip away at the cashier market - which currently employs some 3 and a half million people.
- This year Amazon surpassed FedEx on the number of packages delivered, and just their own delivery network could see them shipping 10 billion packages by 2027. Amazon continues to develop world class robotics technology and AI - Could we see more growth with drone delivery and sidewalk robots?
- Amazon attempted but ultimately disbanded their foray into healthcare with a joint partnership with Berkshire & JP Morgan Chase. Will we see more in this area?
- Finance looks to be a next big target for Amazon, and leaked documents show they may be teaming up with Goldman for a lending marketplace. Already, they have partnered up with Goldman to announce a new finance cloud at the last AWS Reinvent. Will we be sending mortgage payments to Amazon one day?
- Will the transition to Andy Jassy as CEO be as successful as the same transitions at the other big tech giants - with Tim Cook at Apple and Satya Nadella at Microsoft?
None of these growth areas are specifically modeled out, but offer great upside for Amazon long term.
Amazon Price Target for 2022
$3,800 - this price target represents a 21% increase from its share price of $3150 as of January 19. While I would love to see Amazon hit the elusive $4,000 target this year, I think it will be 2023 before this happens.
At Amazon’s scale, just some of these macro factors are a good intro to start understanding Amazon and how big they could possibly become.
The full valuation here is a combination of a 5 year DCF revenue exit, EBIDTA multiple forecast, macro drivers, and some more bottom up specifics - linked in the google doc. Please let me know if you have any thoughts or ideas.
Be sure to subscribe to the Exponential Layers newsletter and YouTube channel to get all updates on new videos and articles.


Comments ()