
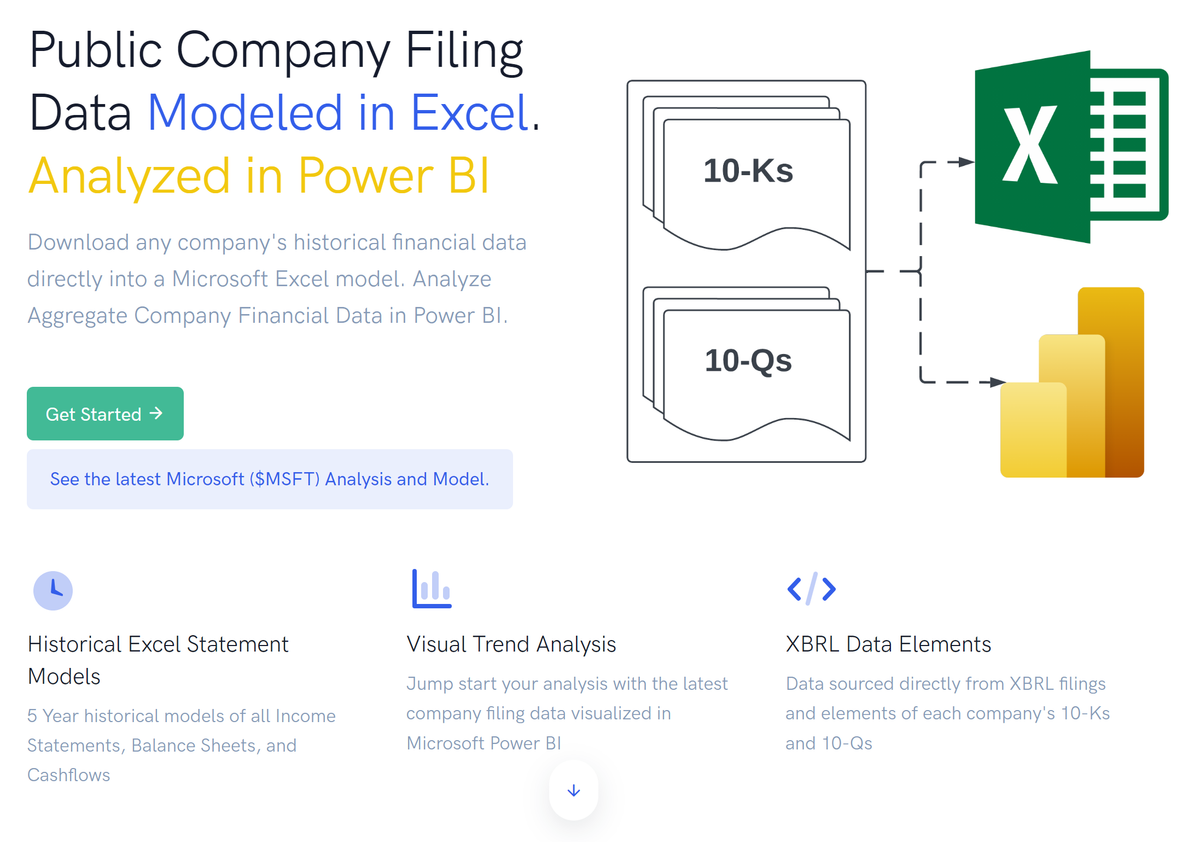
Public Company Analysis - New Beta Platform
Can we use visual analytics to save time and quickly understand company information and potential investment outliers?
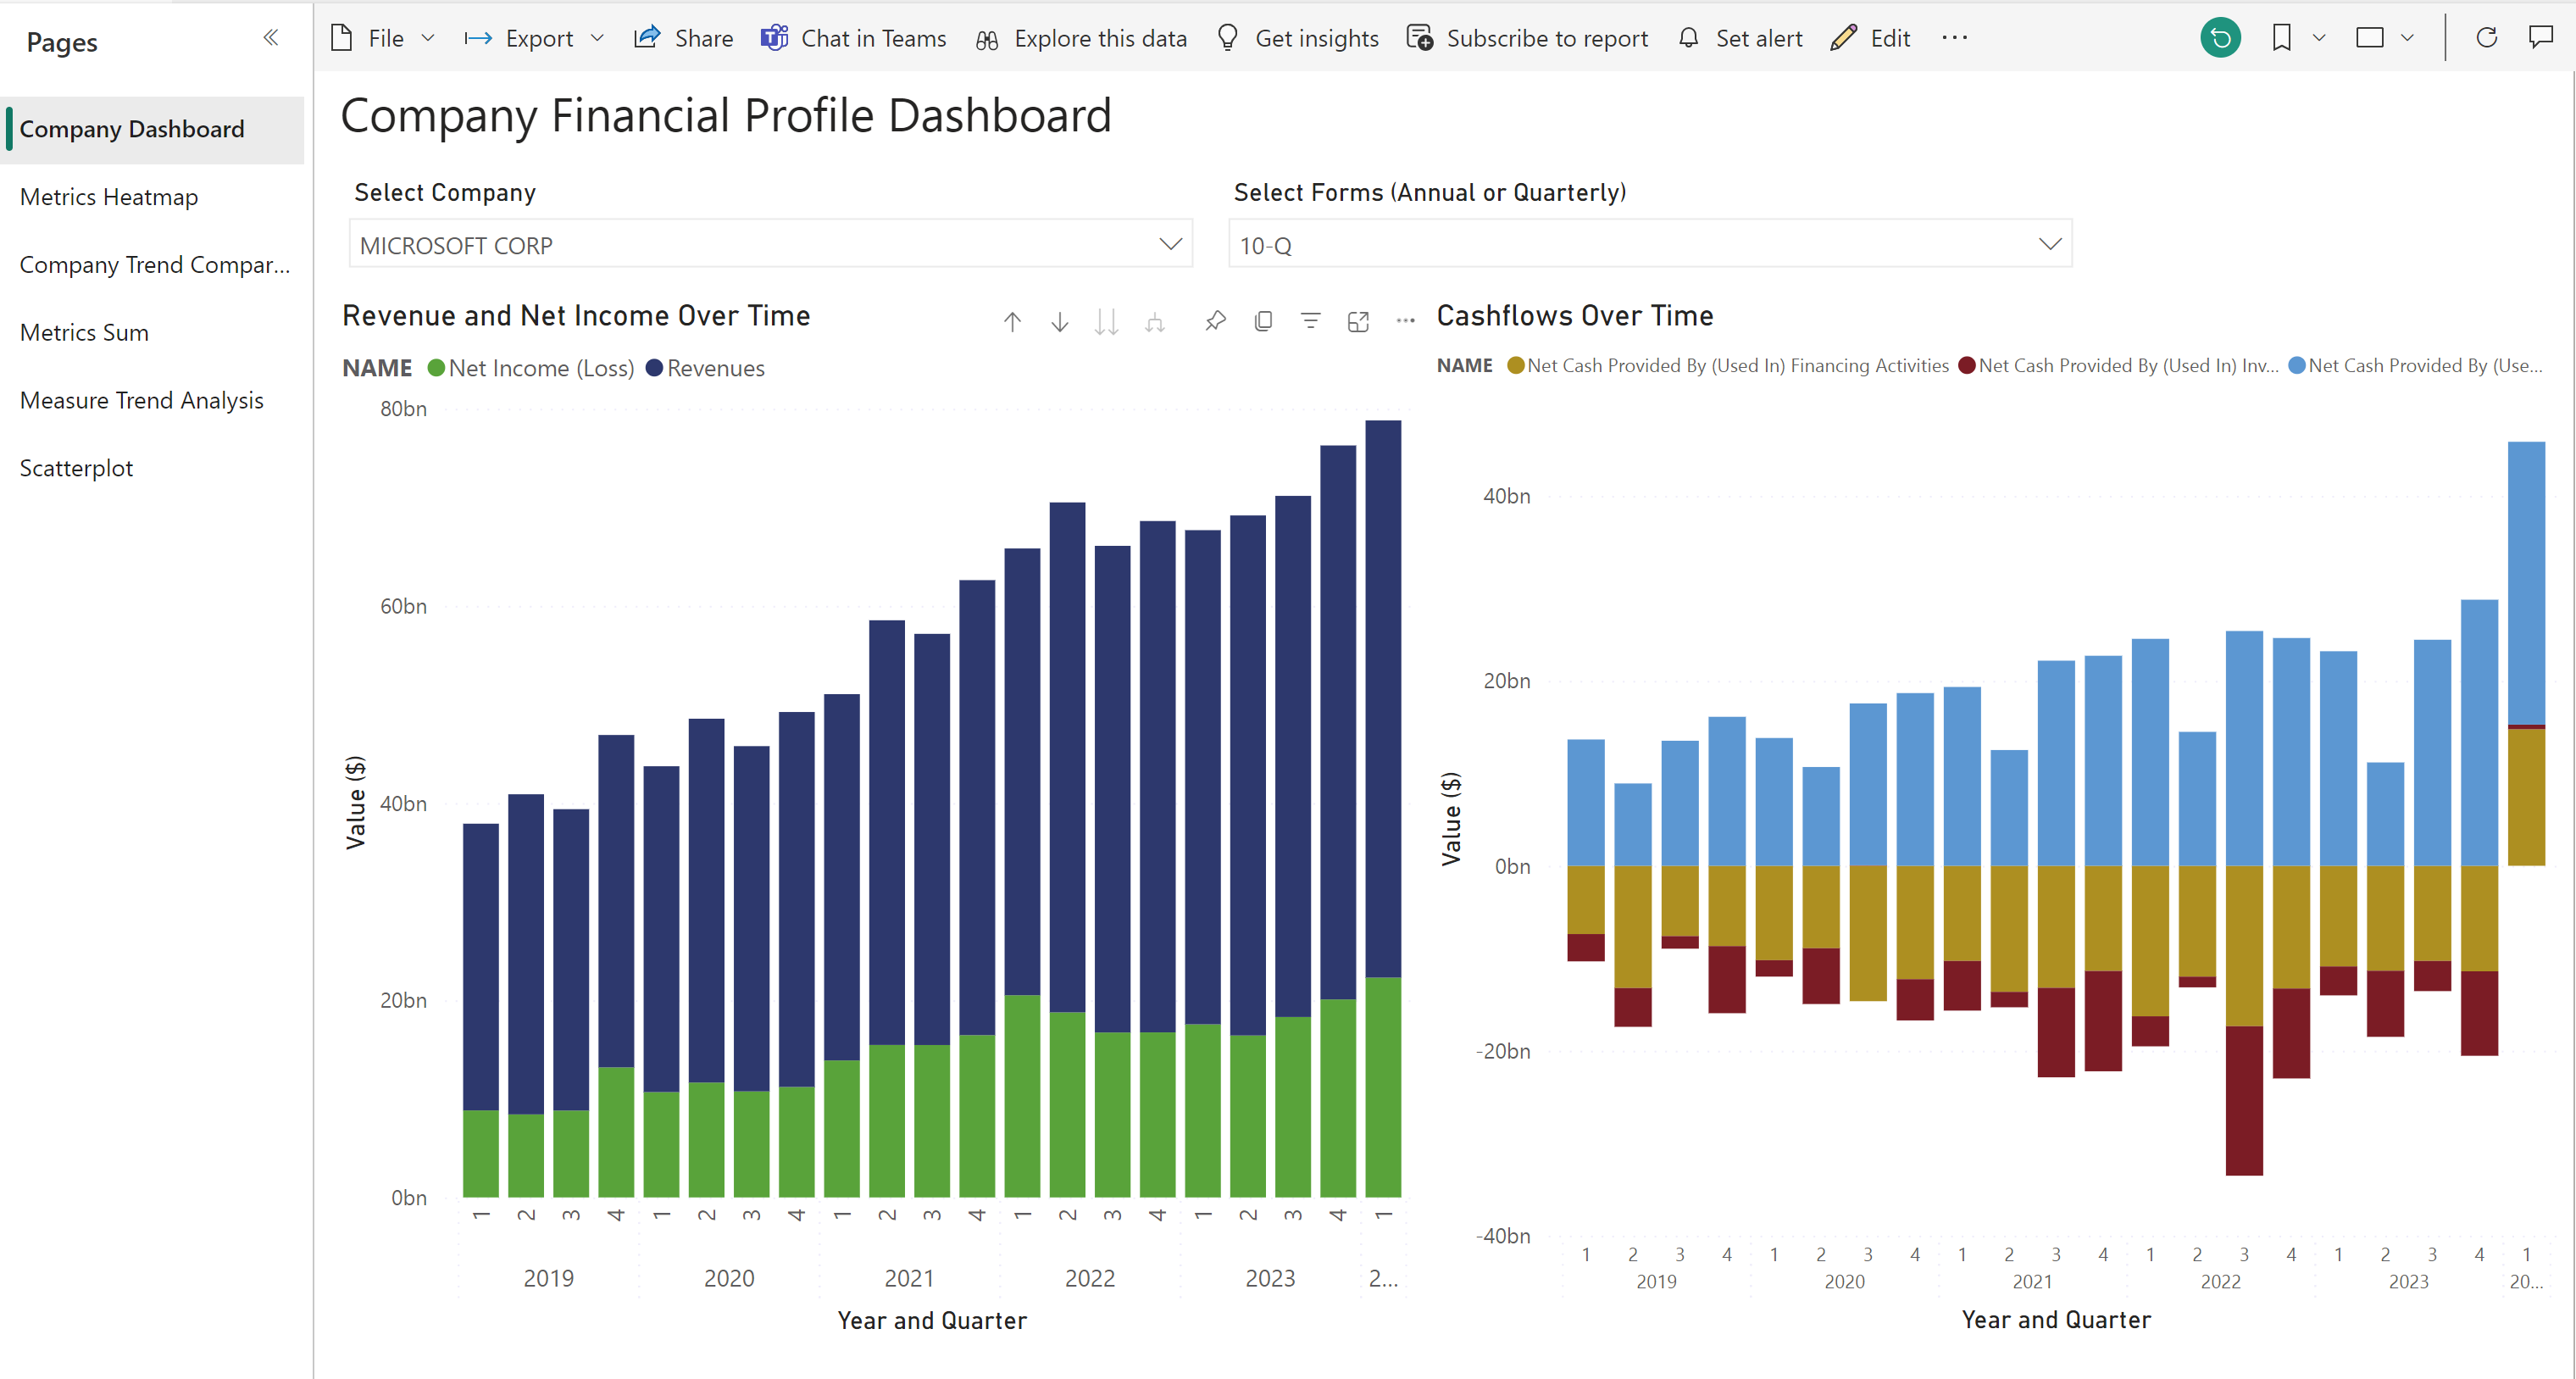
Problem 1: How can we 'Spot Check' a Company?
ChatGPT, tell me what I need to know about this company for research and investment purposes...
We have a company in mind we would like to quickly analyze, research, or spot check...
There are many ways to understand the company - reading the 10-K's, understanding and researching the sector, learning about all of the products and services they offer - this goes on and on and is never replaceable when making any sort of investment decision.
But it takes a lot of time.
And even when understanding what a company does, the next question is some version of "how well are they doing it?" or "how well will they be doing?"
This question recursively prompts more questions - "what do their key financial metrics look like?"... "How are these metrics trending over time, and how do they stack up with other industry peers?" ... "What projections do we have for the future for their business?"
And then even with these questions answered, there are still an infinite number of other companies and combinations of strategies to consider.
As a retail investor with limited time, what tools do I have for quickly getting a financial picture of a company? Rather than parse through years worth of 10-K's, can I consolidate all financial information into a single model? Or better yet, can I have visual analytics to help quickly tell the story?
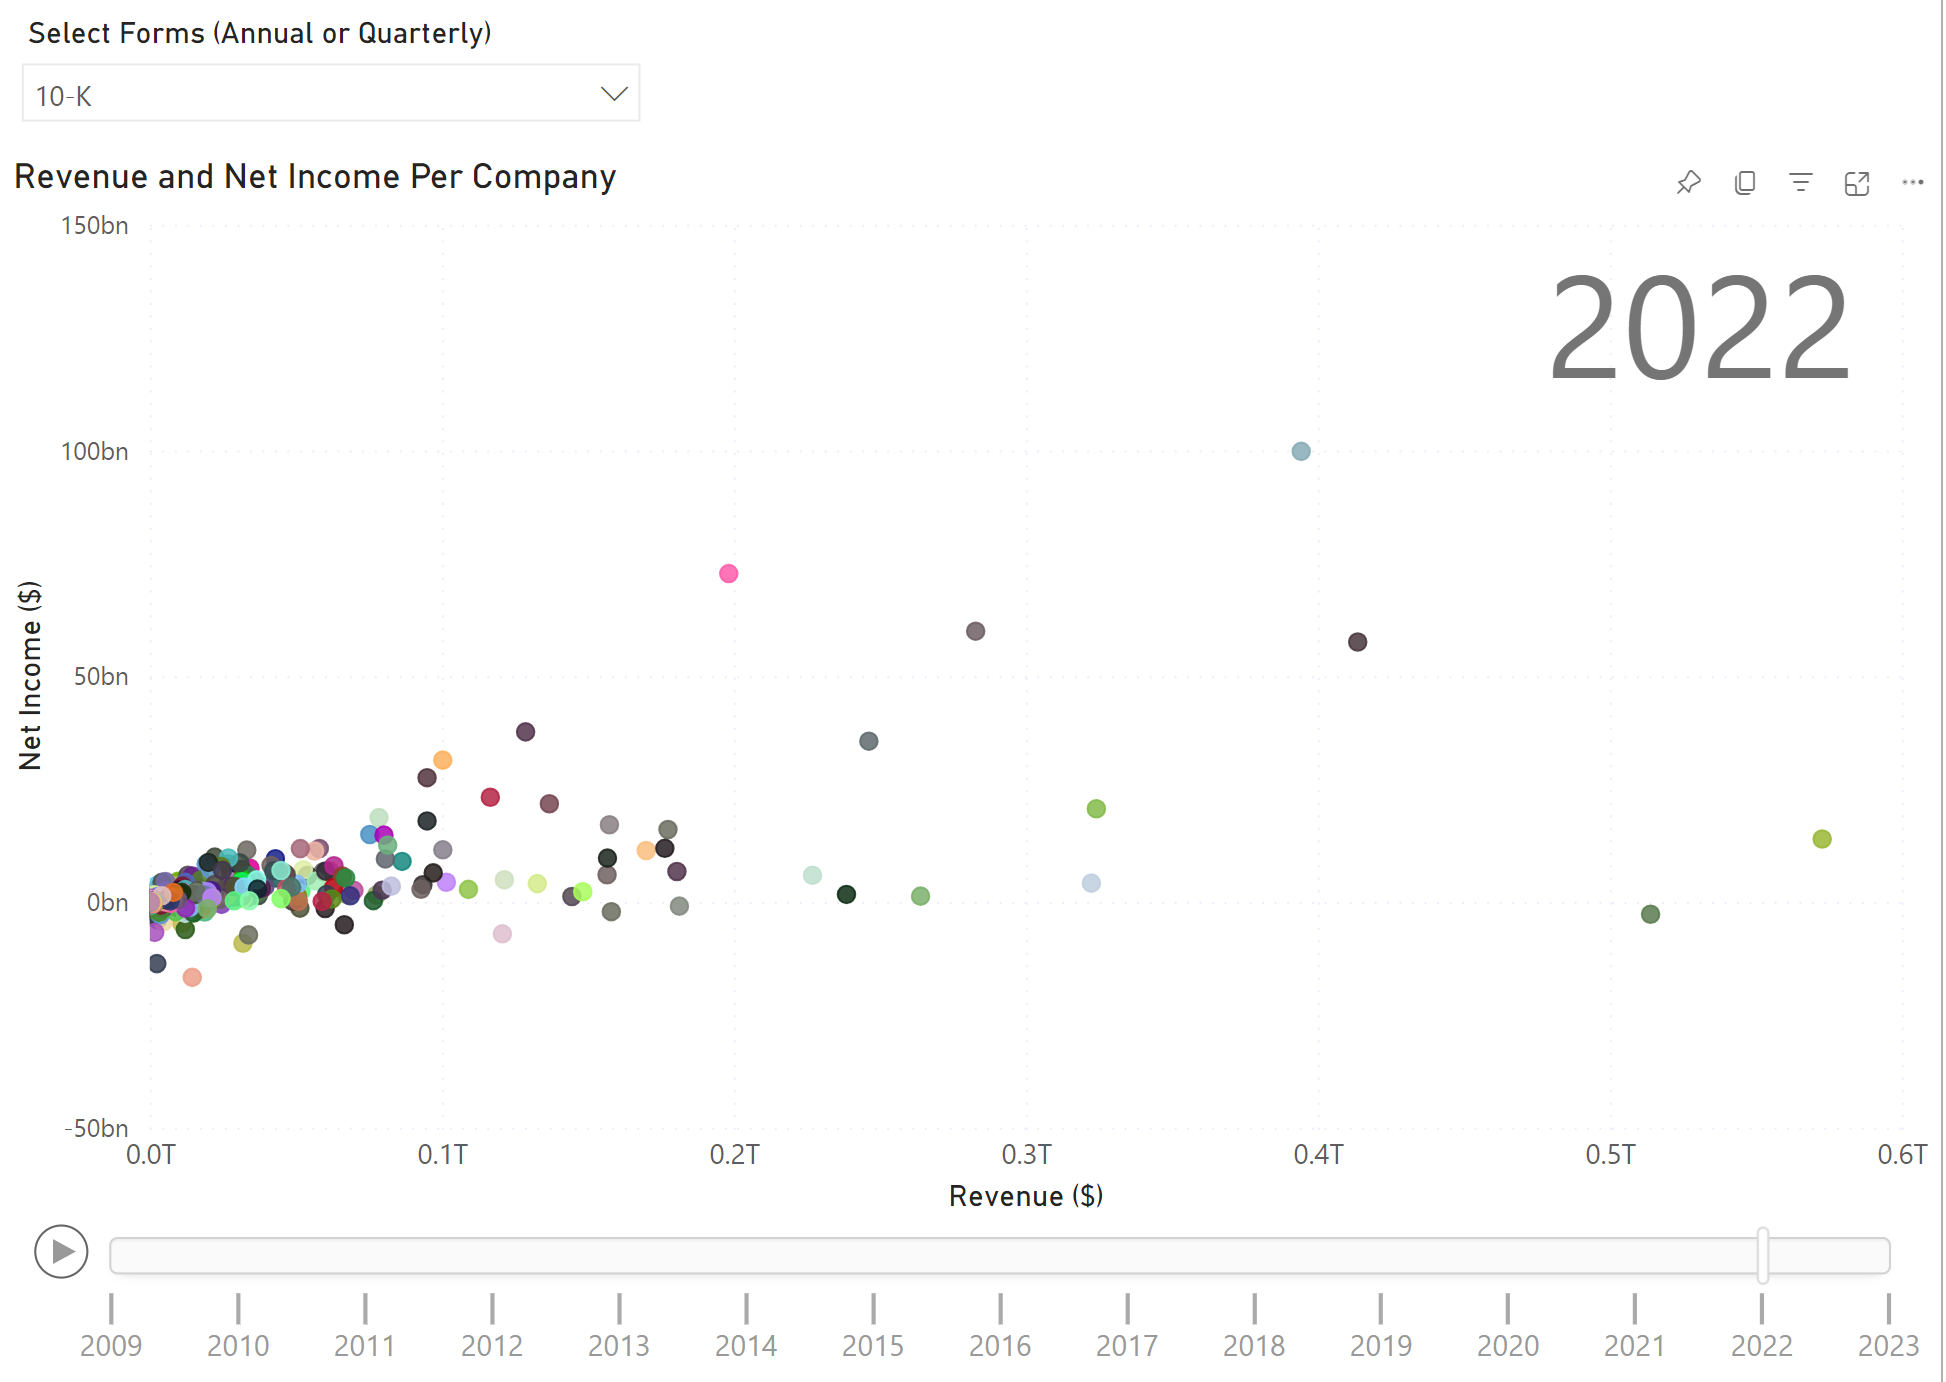
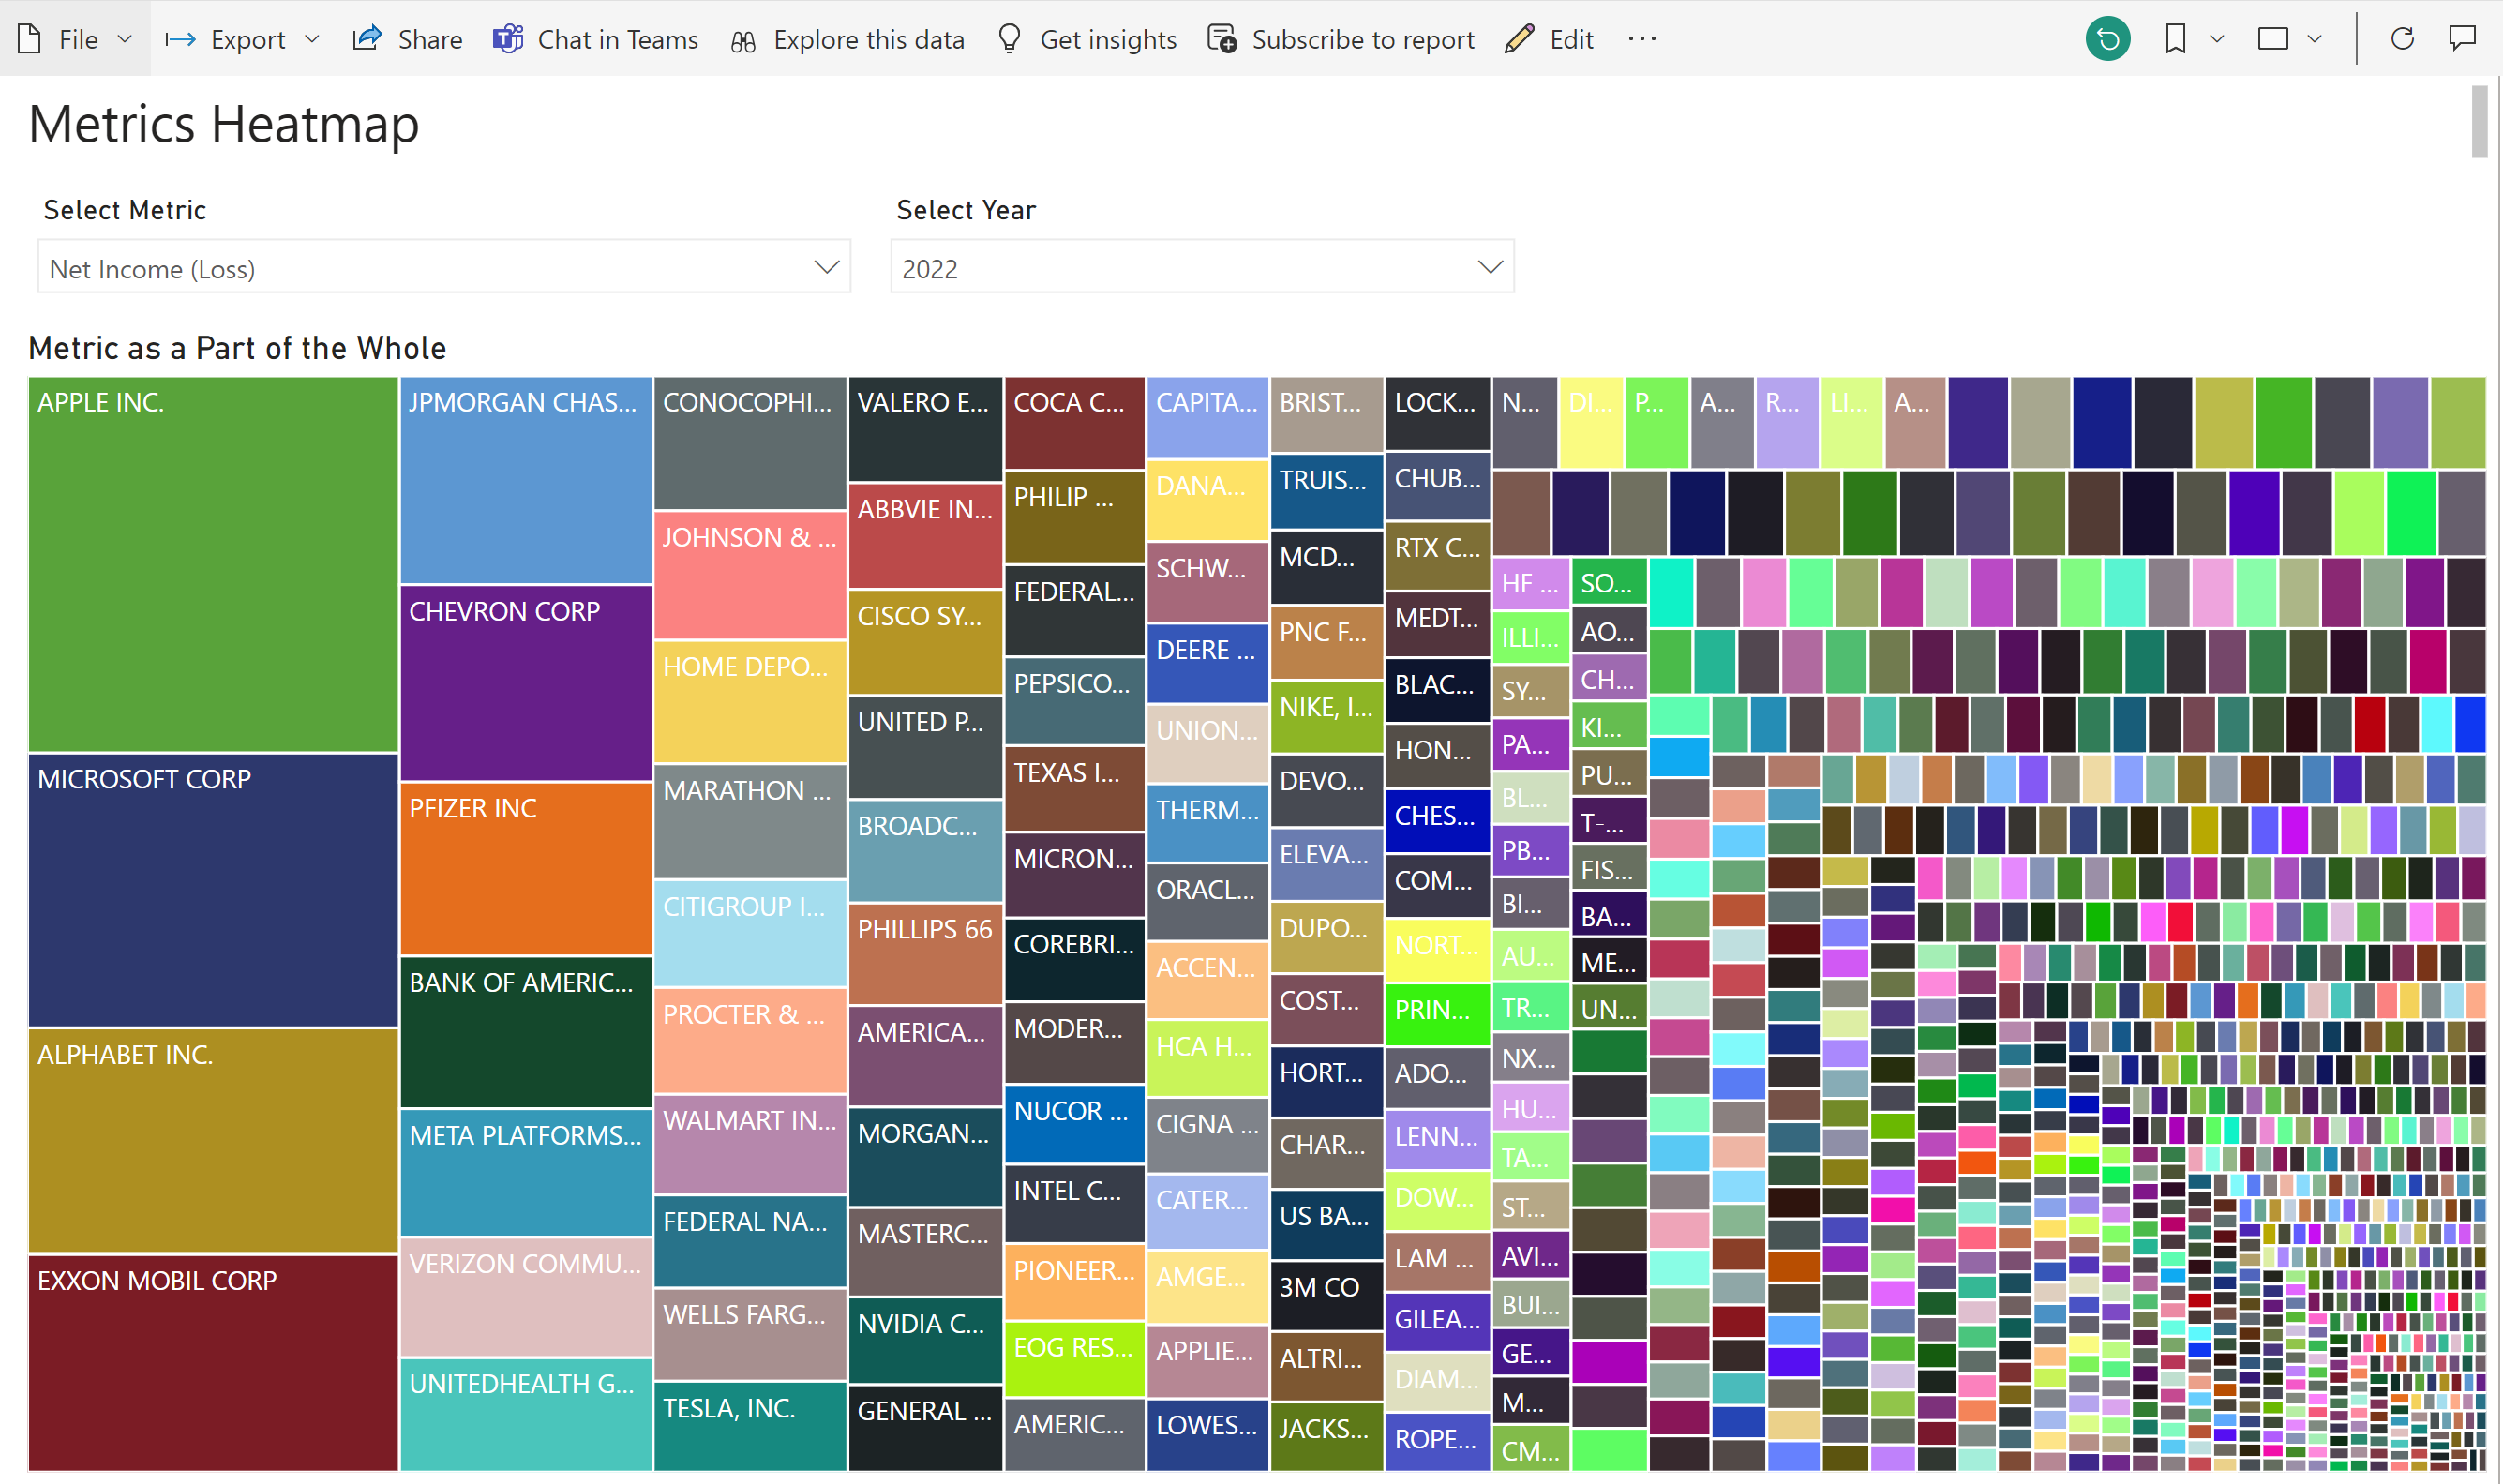
Problem 2: How can we 'Visually Screen' Companies?
ChatGPT, find me the list of companies that best fit the opportunities associated with <trend>. Sort the companies based on <historical and projected financial metrics>. Adjust for <risk factors>
There are thousands of public companies to chose from when investing. How can we quickly experiment to narrow the list?
There are so many ways to screen and reduce the list of companies to go analyze. Even then, the screening process requires an upfront input of metrics and their values to use as a filter.
Is there a more 'free flow' way of analyzing the data to find whatever needle in the haystack may be an outlier or worth investigating further?
Sign Up for the Layers Beta List
With any analytics, the value of the decision and associated outcome must outweigh the time and resources involved in sourcing, processing, storing, and analyzing the data.
Having a suite of dashboards and visual analytics at the top of the funnel for research purposes may offer one more tool that could potentially save time, offer new perspective, or help in a research process.
If any of this is something you would be interested in exploring, please create a free account here or sign up for this newsletter to join the beta list.


Comments ()