
Lightning Network Highlights and Exponential Layers Updates from August
Total Capacity of the Lightning Network Increased 4.6% in August. A look at key network highlights and Exponential Layers feature releases.

There is no slowing down the growth of the Lightning Network, and the Lightning Network steadily increased overall capacity throughout August.
This research report from Lyn Alden, also published in August, eloquently captures everything in Bitcoin and Lightning - the monetary history, the reasons for scaling, criticisms and counterpoints, and the 'why' behind everything (among other points).


Among all of this background, one thing that stands out about the Lightning Network is its utility. Quoting from Lyn Alden’s report:
“Lightning’s growth, including through a bear market, it is mainly due to organic utility and need for it, rather than primarily for speculation, trading, leveraging, or for any sort of pump-and-dump VC-funded incentivization scheme that relies on using retail investors as exit liquidity.”
In the spirit of looking into this utility, here are metrics and highlights from the Lightning Network in August, along with updates and release notes from Exponential Layers.
Network Capacity
No metric is perfect for determining the success and growth of the Lightning Network. But Total Public Capacity is a key indicator of growth and utility.
Total Public Capacity refers to liquidity (Bitcoin) deployed onto the network in public channels. By deploying capital into the network, Node Operators (and anyone funding them) are indicating the value and utility they see in the network.
This capital and liquidity also serves as a primary utility for how the LN operates, acting as a base for sending and forwarding payments. Total liquidity in a payment route is an upper bound on a transaction total (a 1 bitcoin channel can send or forward a maximum 1 bitcoin payment assuming correct channel balance).
There is no exact formula for correlating total payment volume on the network with capacity - a single bitcoin in capacity on the network could serve as a base for millions of payments back and forth across the network. But capacity can serve as a good proxy for looking at extrapolation of overall volume.
Total Capacity in August increased 4.6% - from 4,450 bitcoin to 4,654 bitcoin
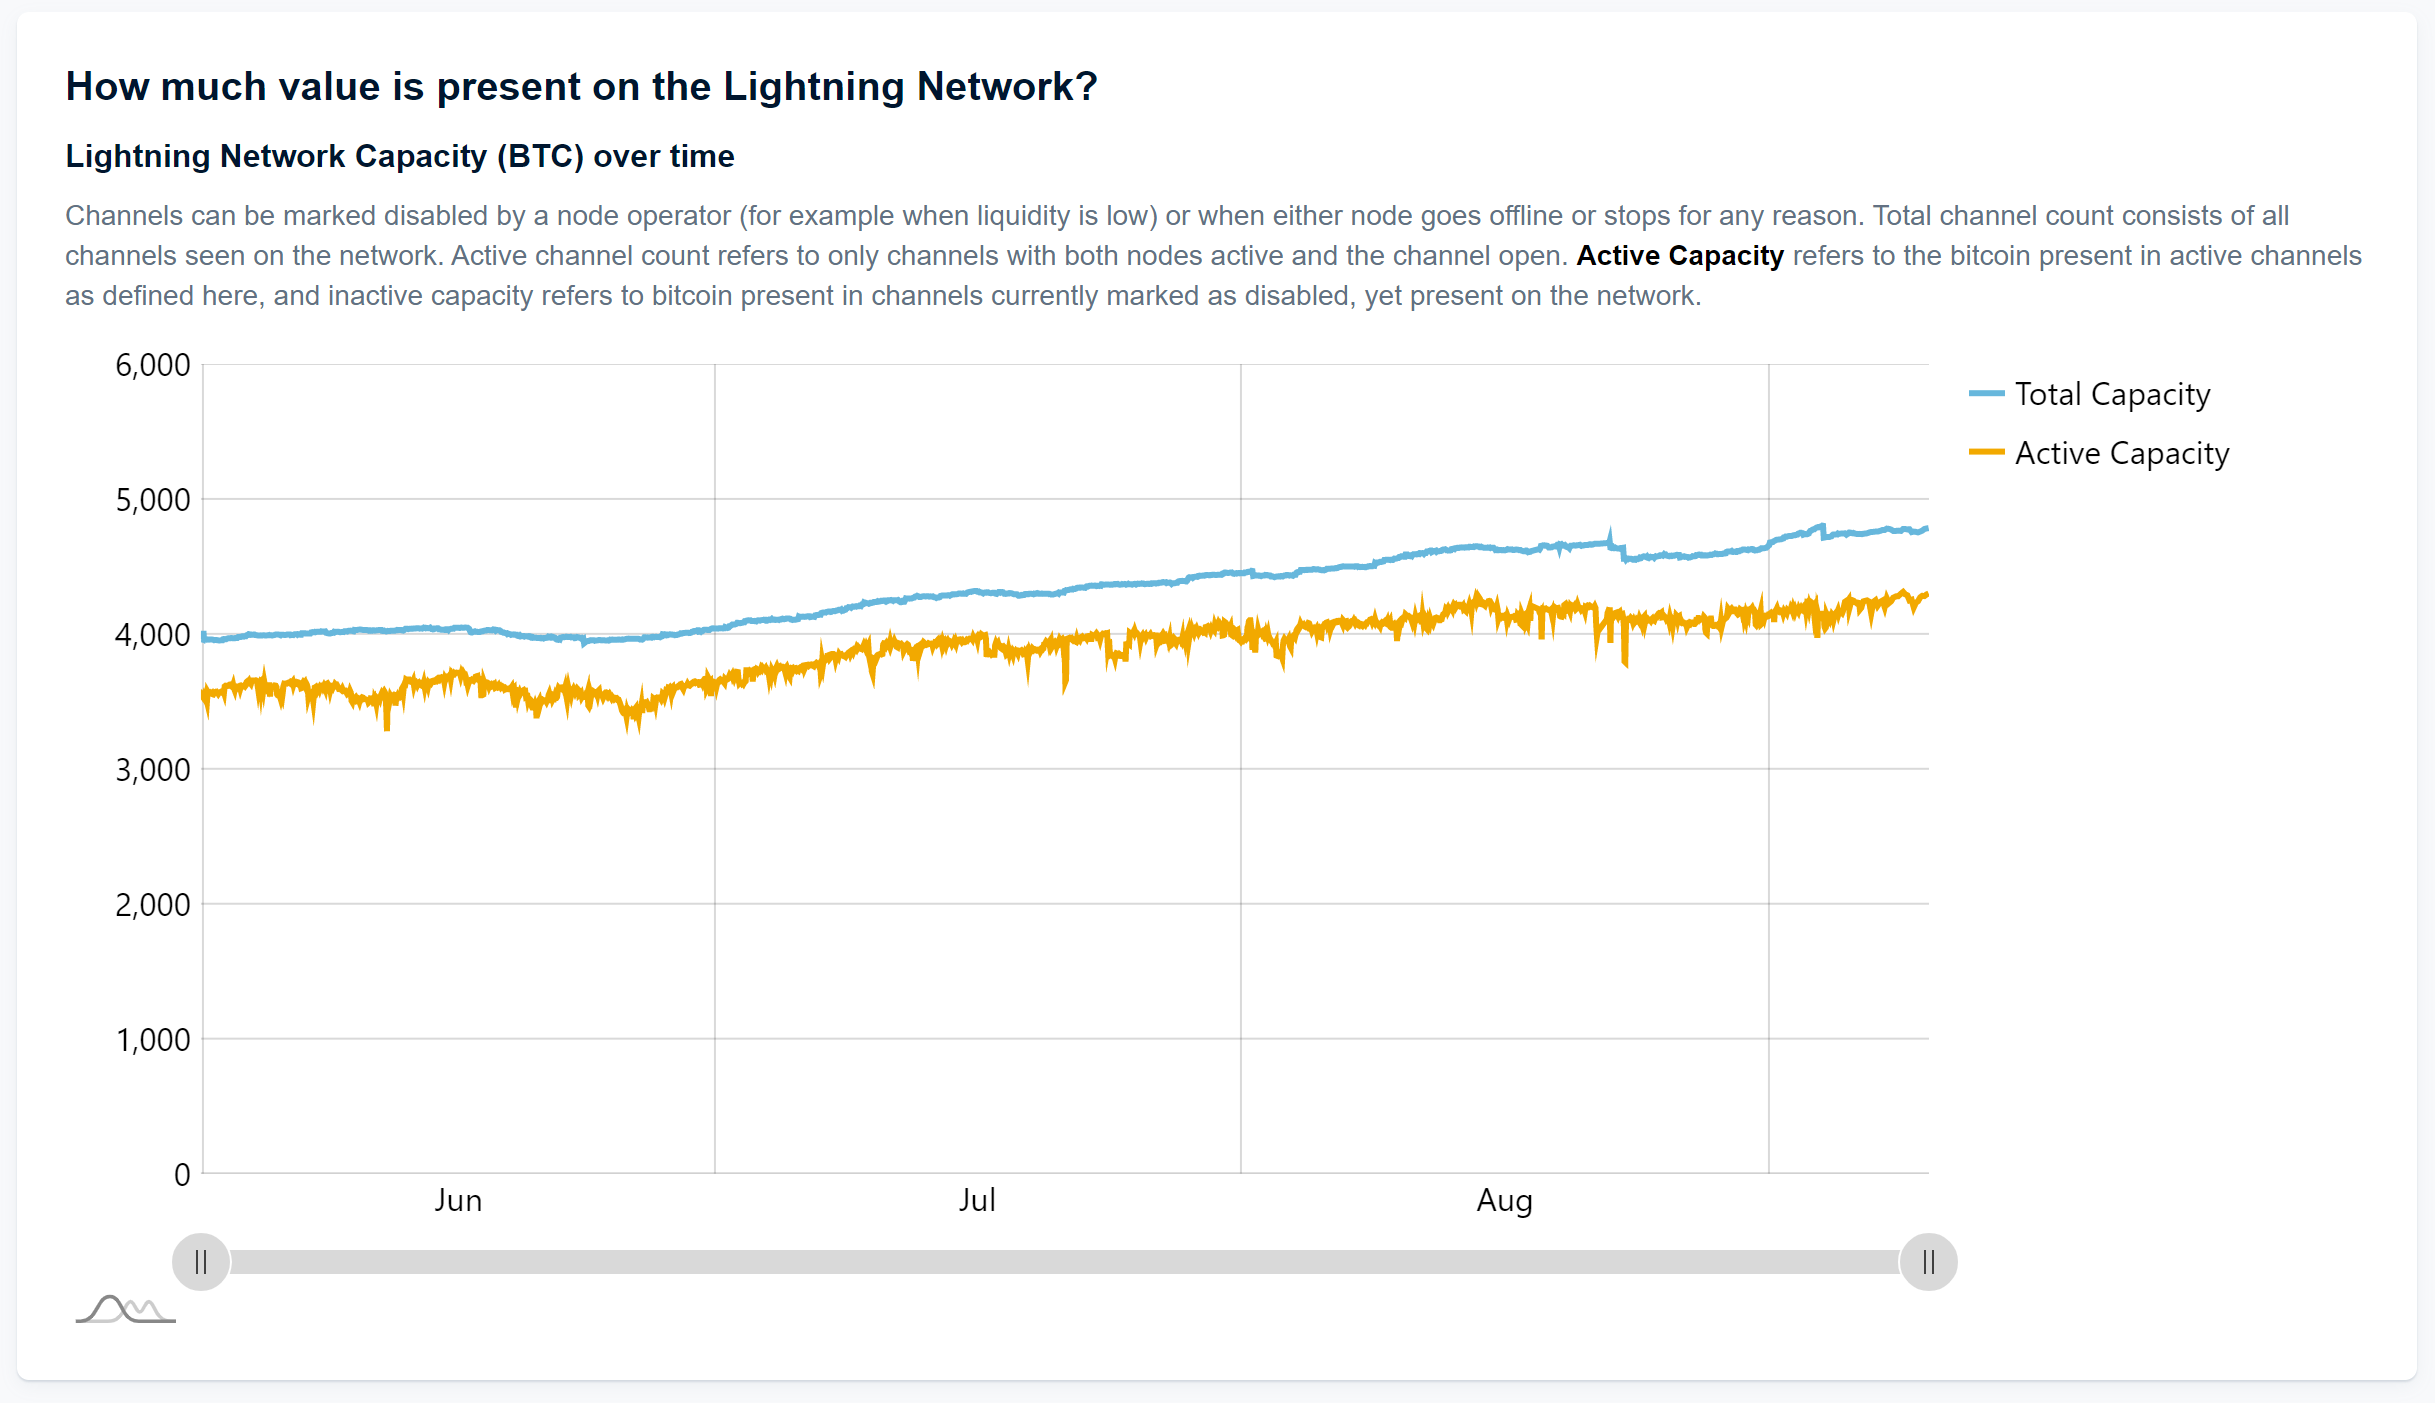
The Lightning Network is an ever evolving graph of Nodes and their payment routes (Channels). Nodes can join the network at any time, disable channels, and pause operations. For this reason, Exponential Layers also tracks Active Capacity - which refers to total public capacity among channels whose Nodes on both sides are active and with active channel policies. This number is lower than Total Capacity and more active in ongoing changes.
Active Capacity in August increased 4.9% - from 3,949 bitcoin to 4,141 bitcoin.
These numbers show the steady growth of the Network, all despite the backdrop of Bitcoin’s price volatility.
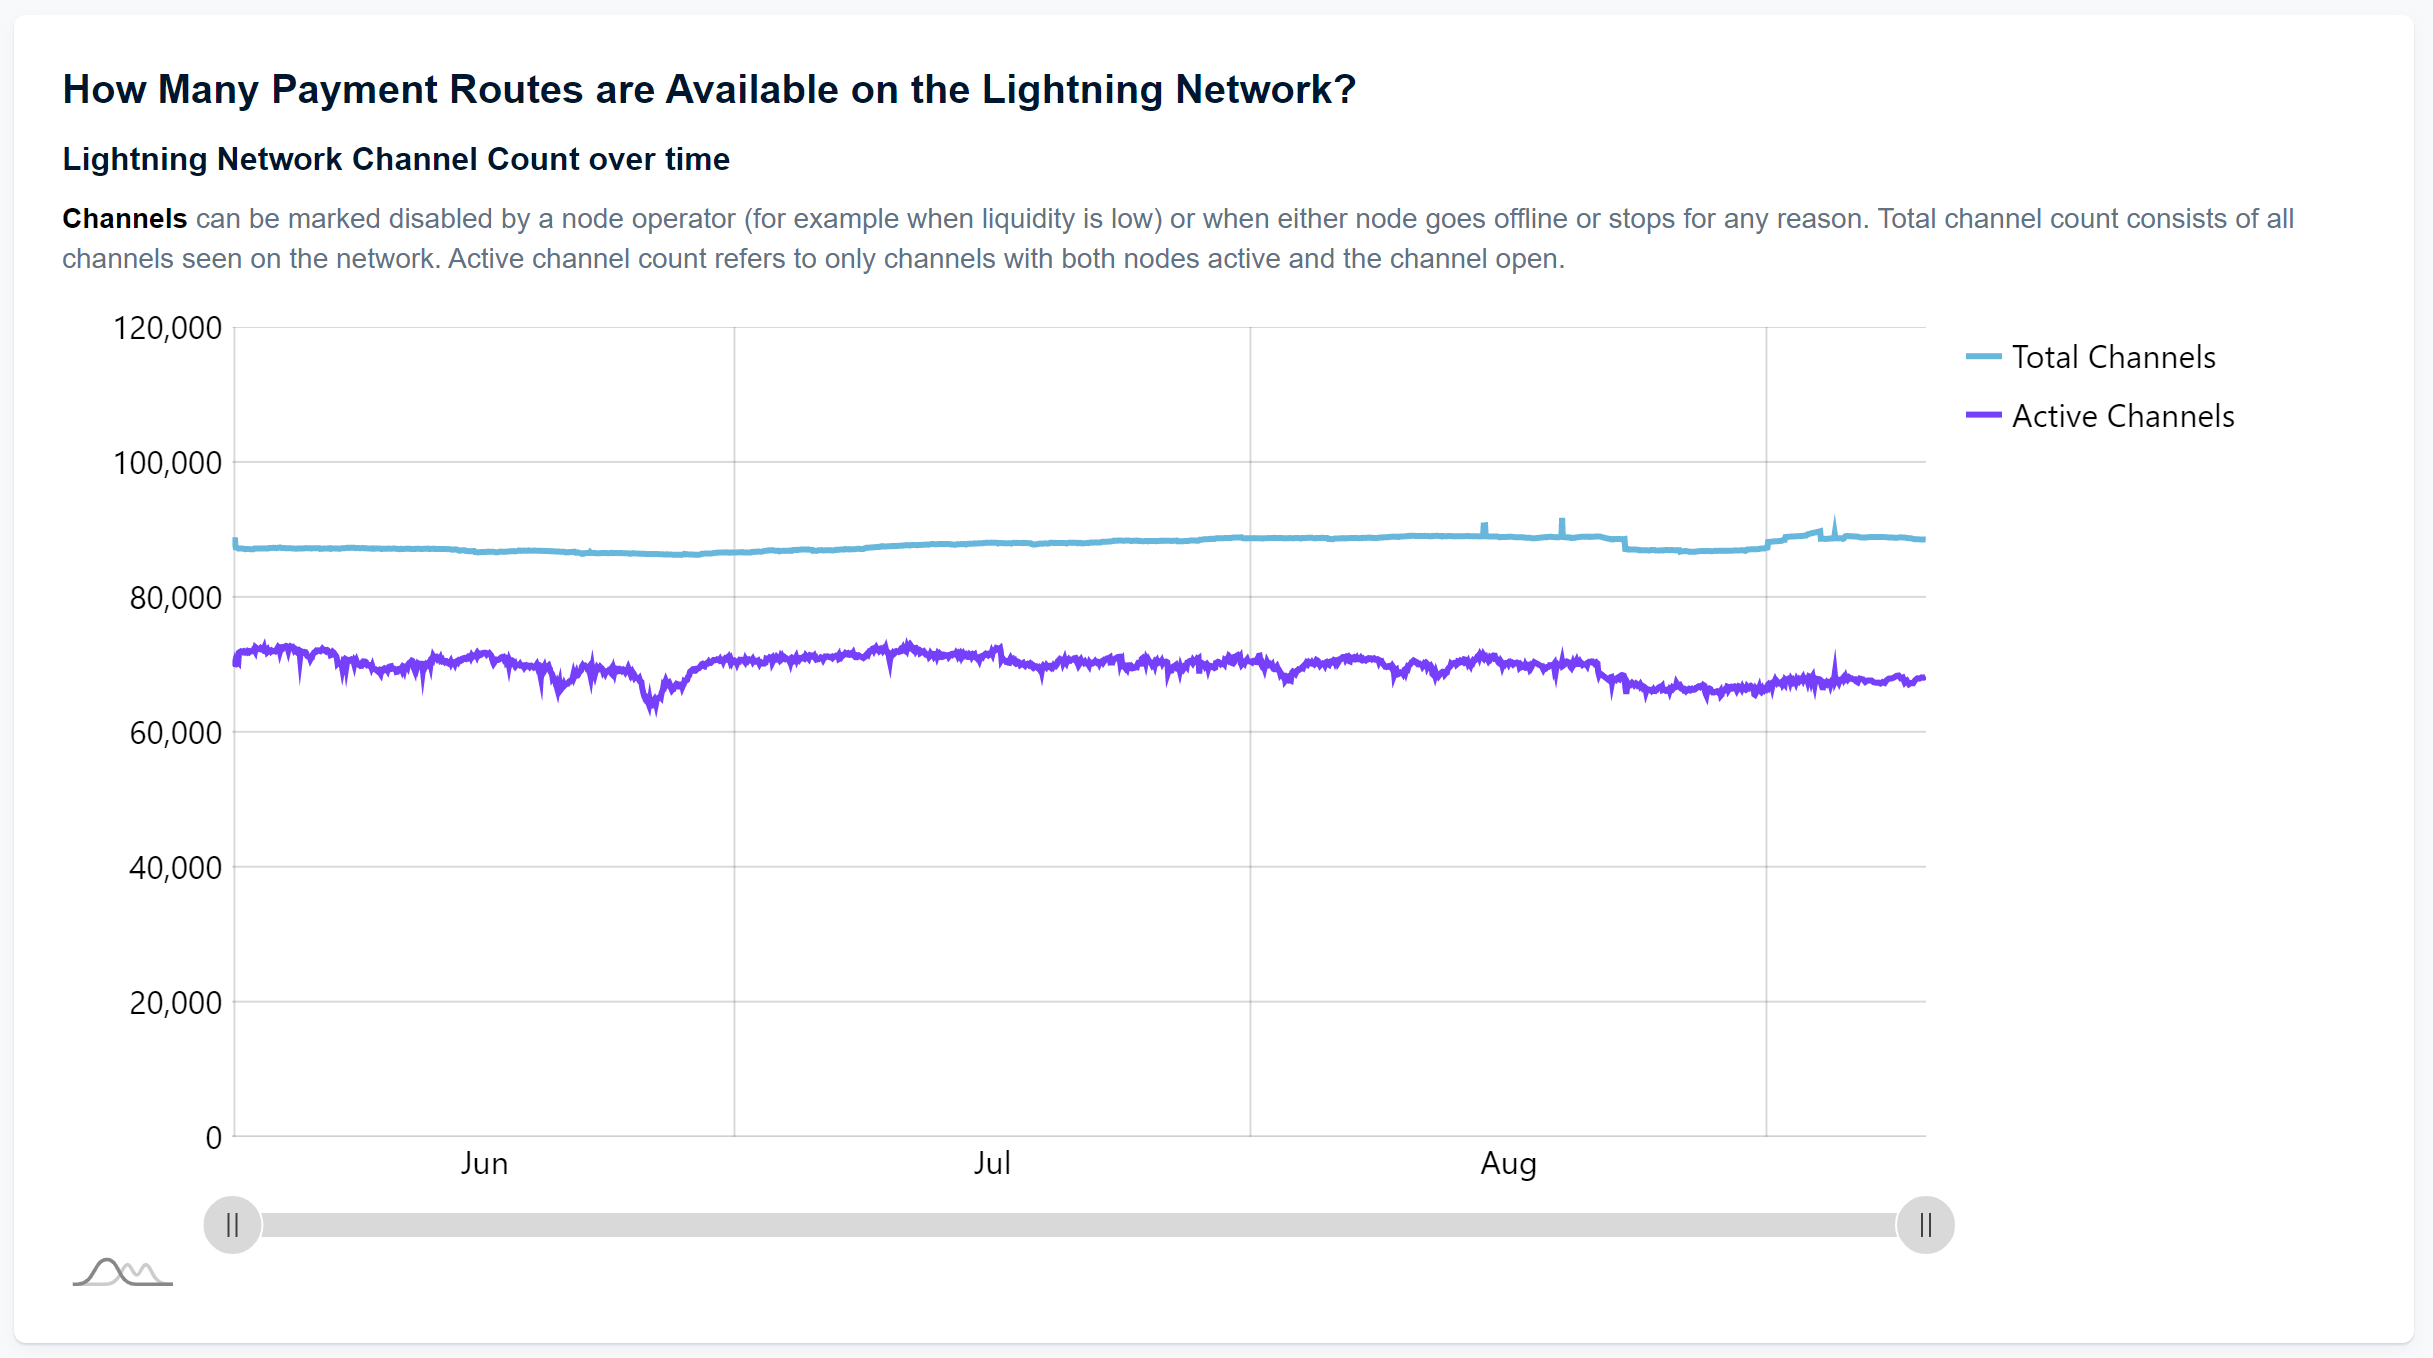
Network Channels
Channels are the Payment Routes between Nodes and the building blocks for the Utility of the network.
In August, Total Channel count decreased 1.9% - from 88,686 channels to 87,043 channels. Active Channel count decreased 5.1% from 70,354 active channels to 66,754 active channels.
Channel Closures
One important change made this month from Exponential Layers was additional refinement on Channel Analytics. We added functionality to pull and sync updates from the Bitcoin Blockchain (in addition to the Lightning Network graph).
Lightning channel opens and closes are transactions on the Bitcoin blockchain. A Channel closure point is not automatically captured in the Lightning Network graph. To help get this data, Exponential Layers looks at ongoing Bitcoin blocks and their transactions to see if and when a Lightning Channel’s opening outpoint is included as an input of a future transaction (marking it closed).
This change was made in the Lightning Network explorer on all channel pages to see the closing transaction of a channel (if the channel is closed). An example of a closed channel and its linked opening Tx and closing Tx can be seen here:

To ensure total network capacity numbers were not inflated, Exponential Layers reprocessed its state of history of the network to provide backward compatibility in counting overall channel capacity.
We will continue this refinement of network data to ensure continued collection of additional blockchain data and metrics that can make our LN analytics as accurate as possible on an ongoing basis.
Introducing the LN Leaderboard and Maps
Capacity and Channel Growth are just two metrics we are tracking to continue highlighting the growth and utility of the network. But there are many other factors to consider and drill into:
- Which nodes increased capacity the most last month?
- What kind of payment volume can be extracted?
- Which nodes run Tor vs Clearnet? And where are all of the nodes?
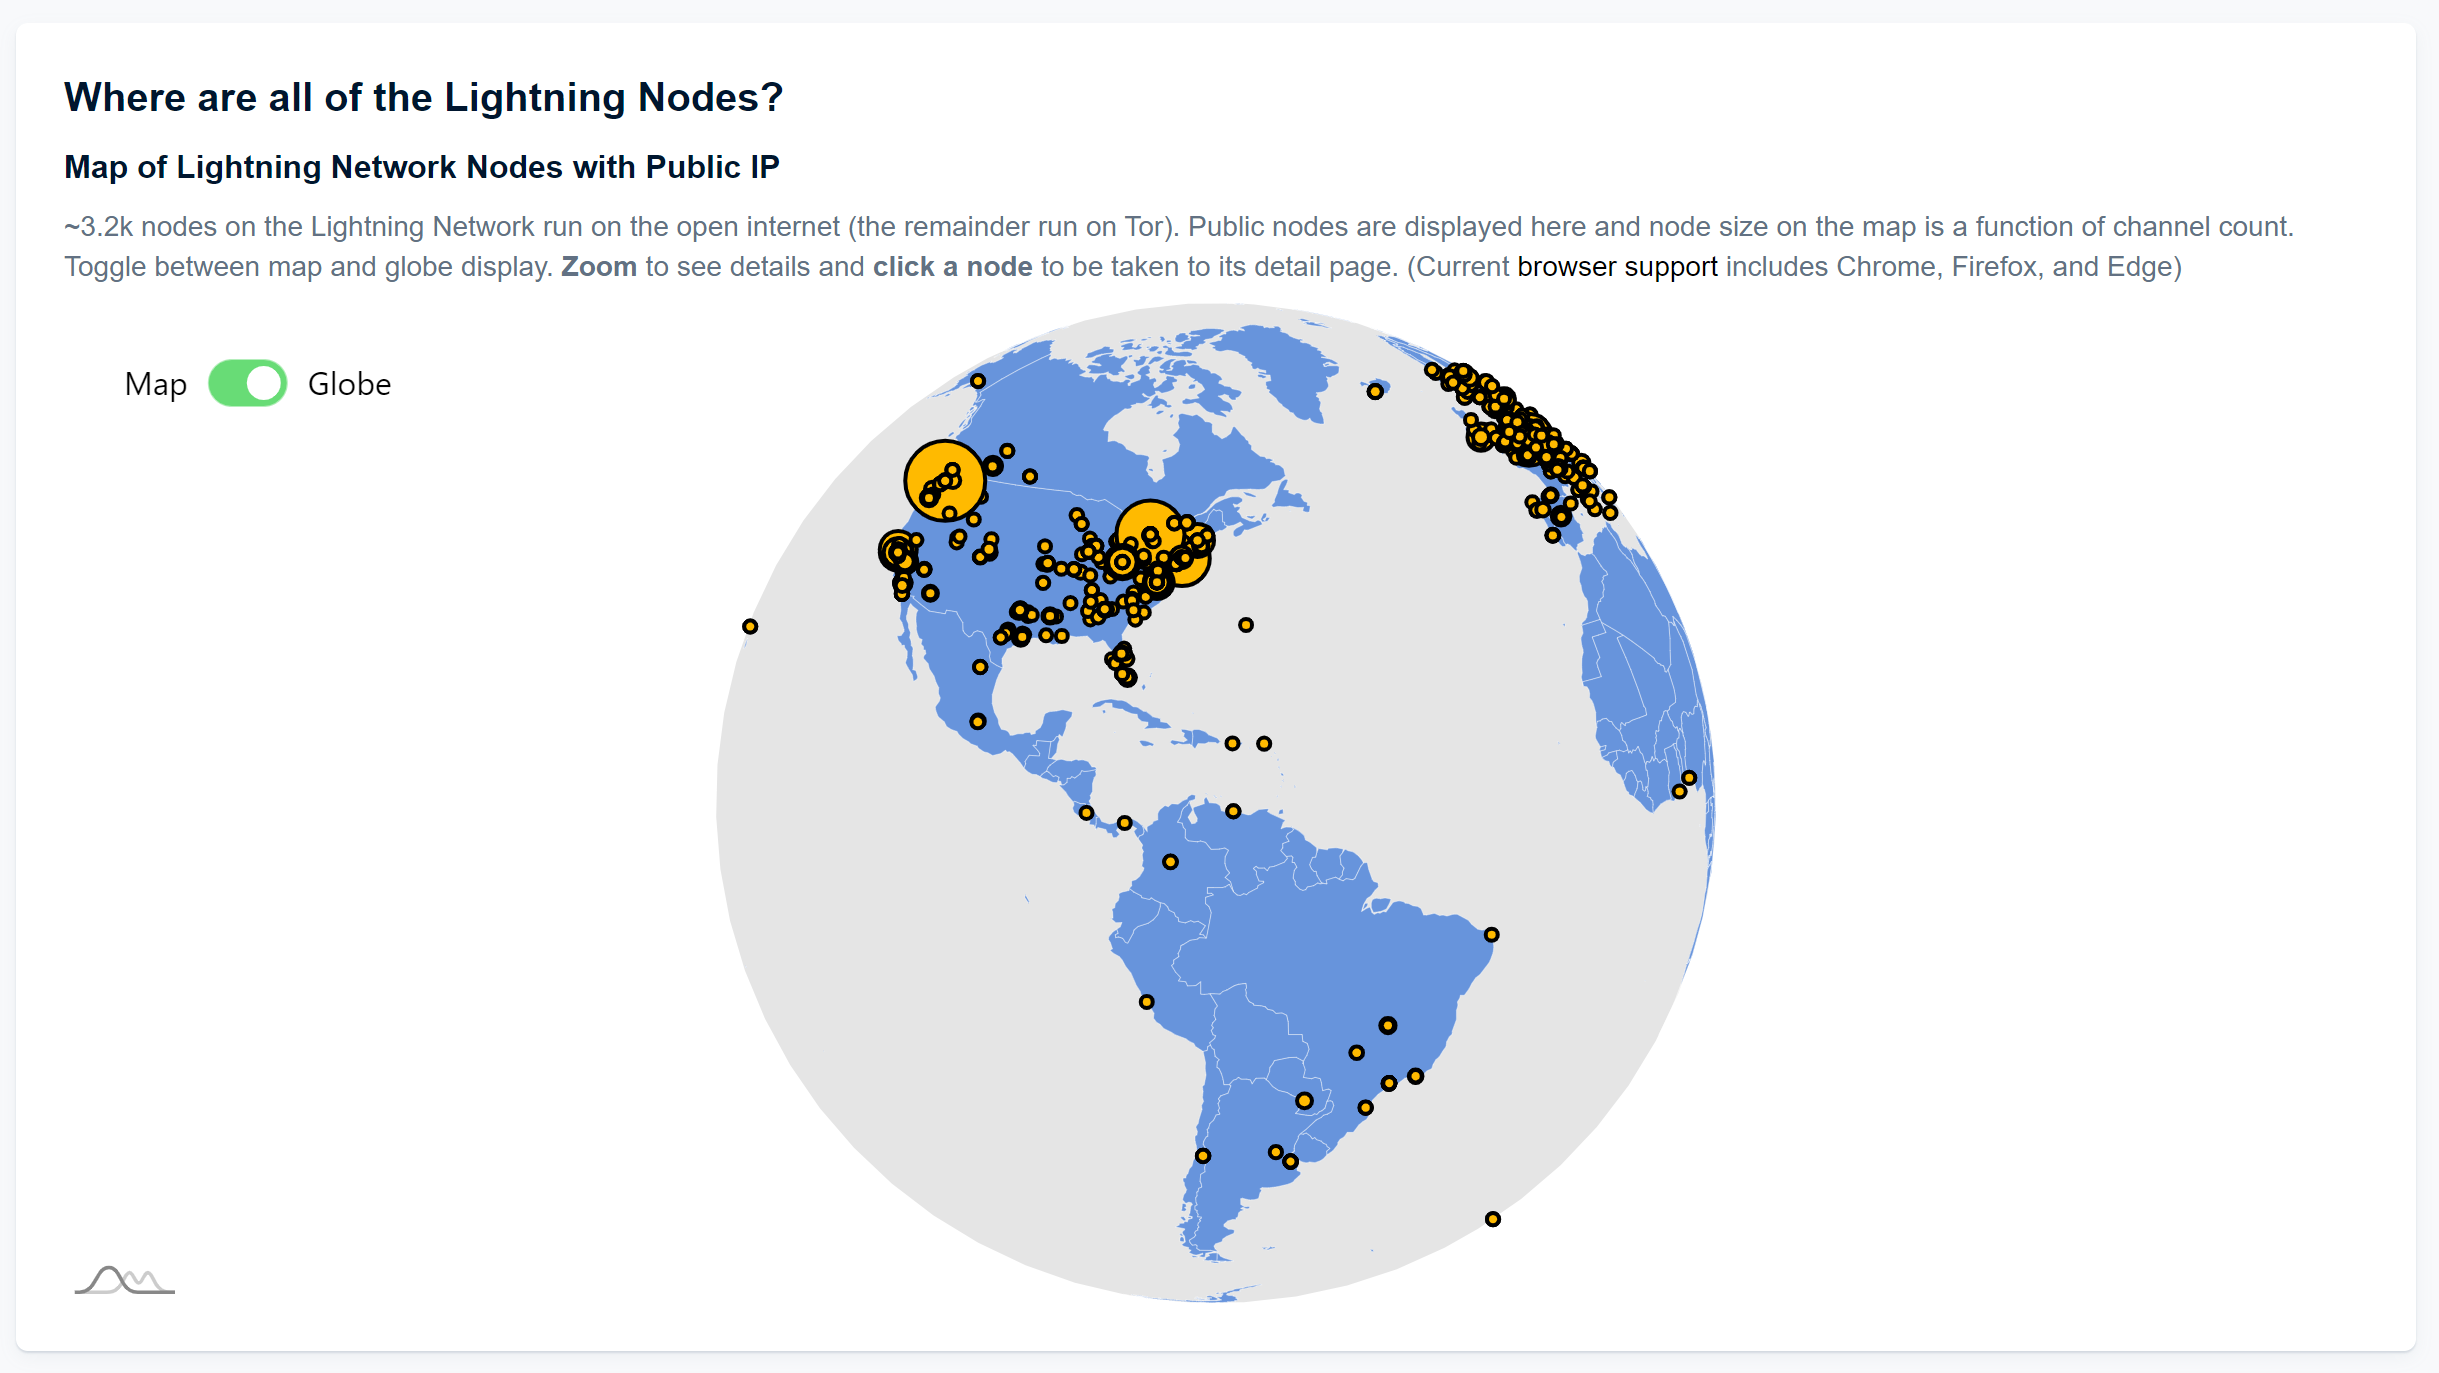
Where Are All of the Lightning Network Nodes?
Exponential Layers relies on third party Geo IP lookup data to provide best estimates on Node geo location and Internet Service Provider (ISP) information. A Map of all clearnet nodes can be seen here. Drill into a node to see its Location and ISP information on its Node page.
The LN Leaderboard
There are many more metrics to look at, and one new feature on Exponential Layers is the Leaderboard - where you can drill into Capacity Changes by Node (tiered by category) over time.
With this insight, you can explore potential new Channel Peers, and see growth and trends in near real time on the network.
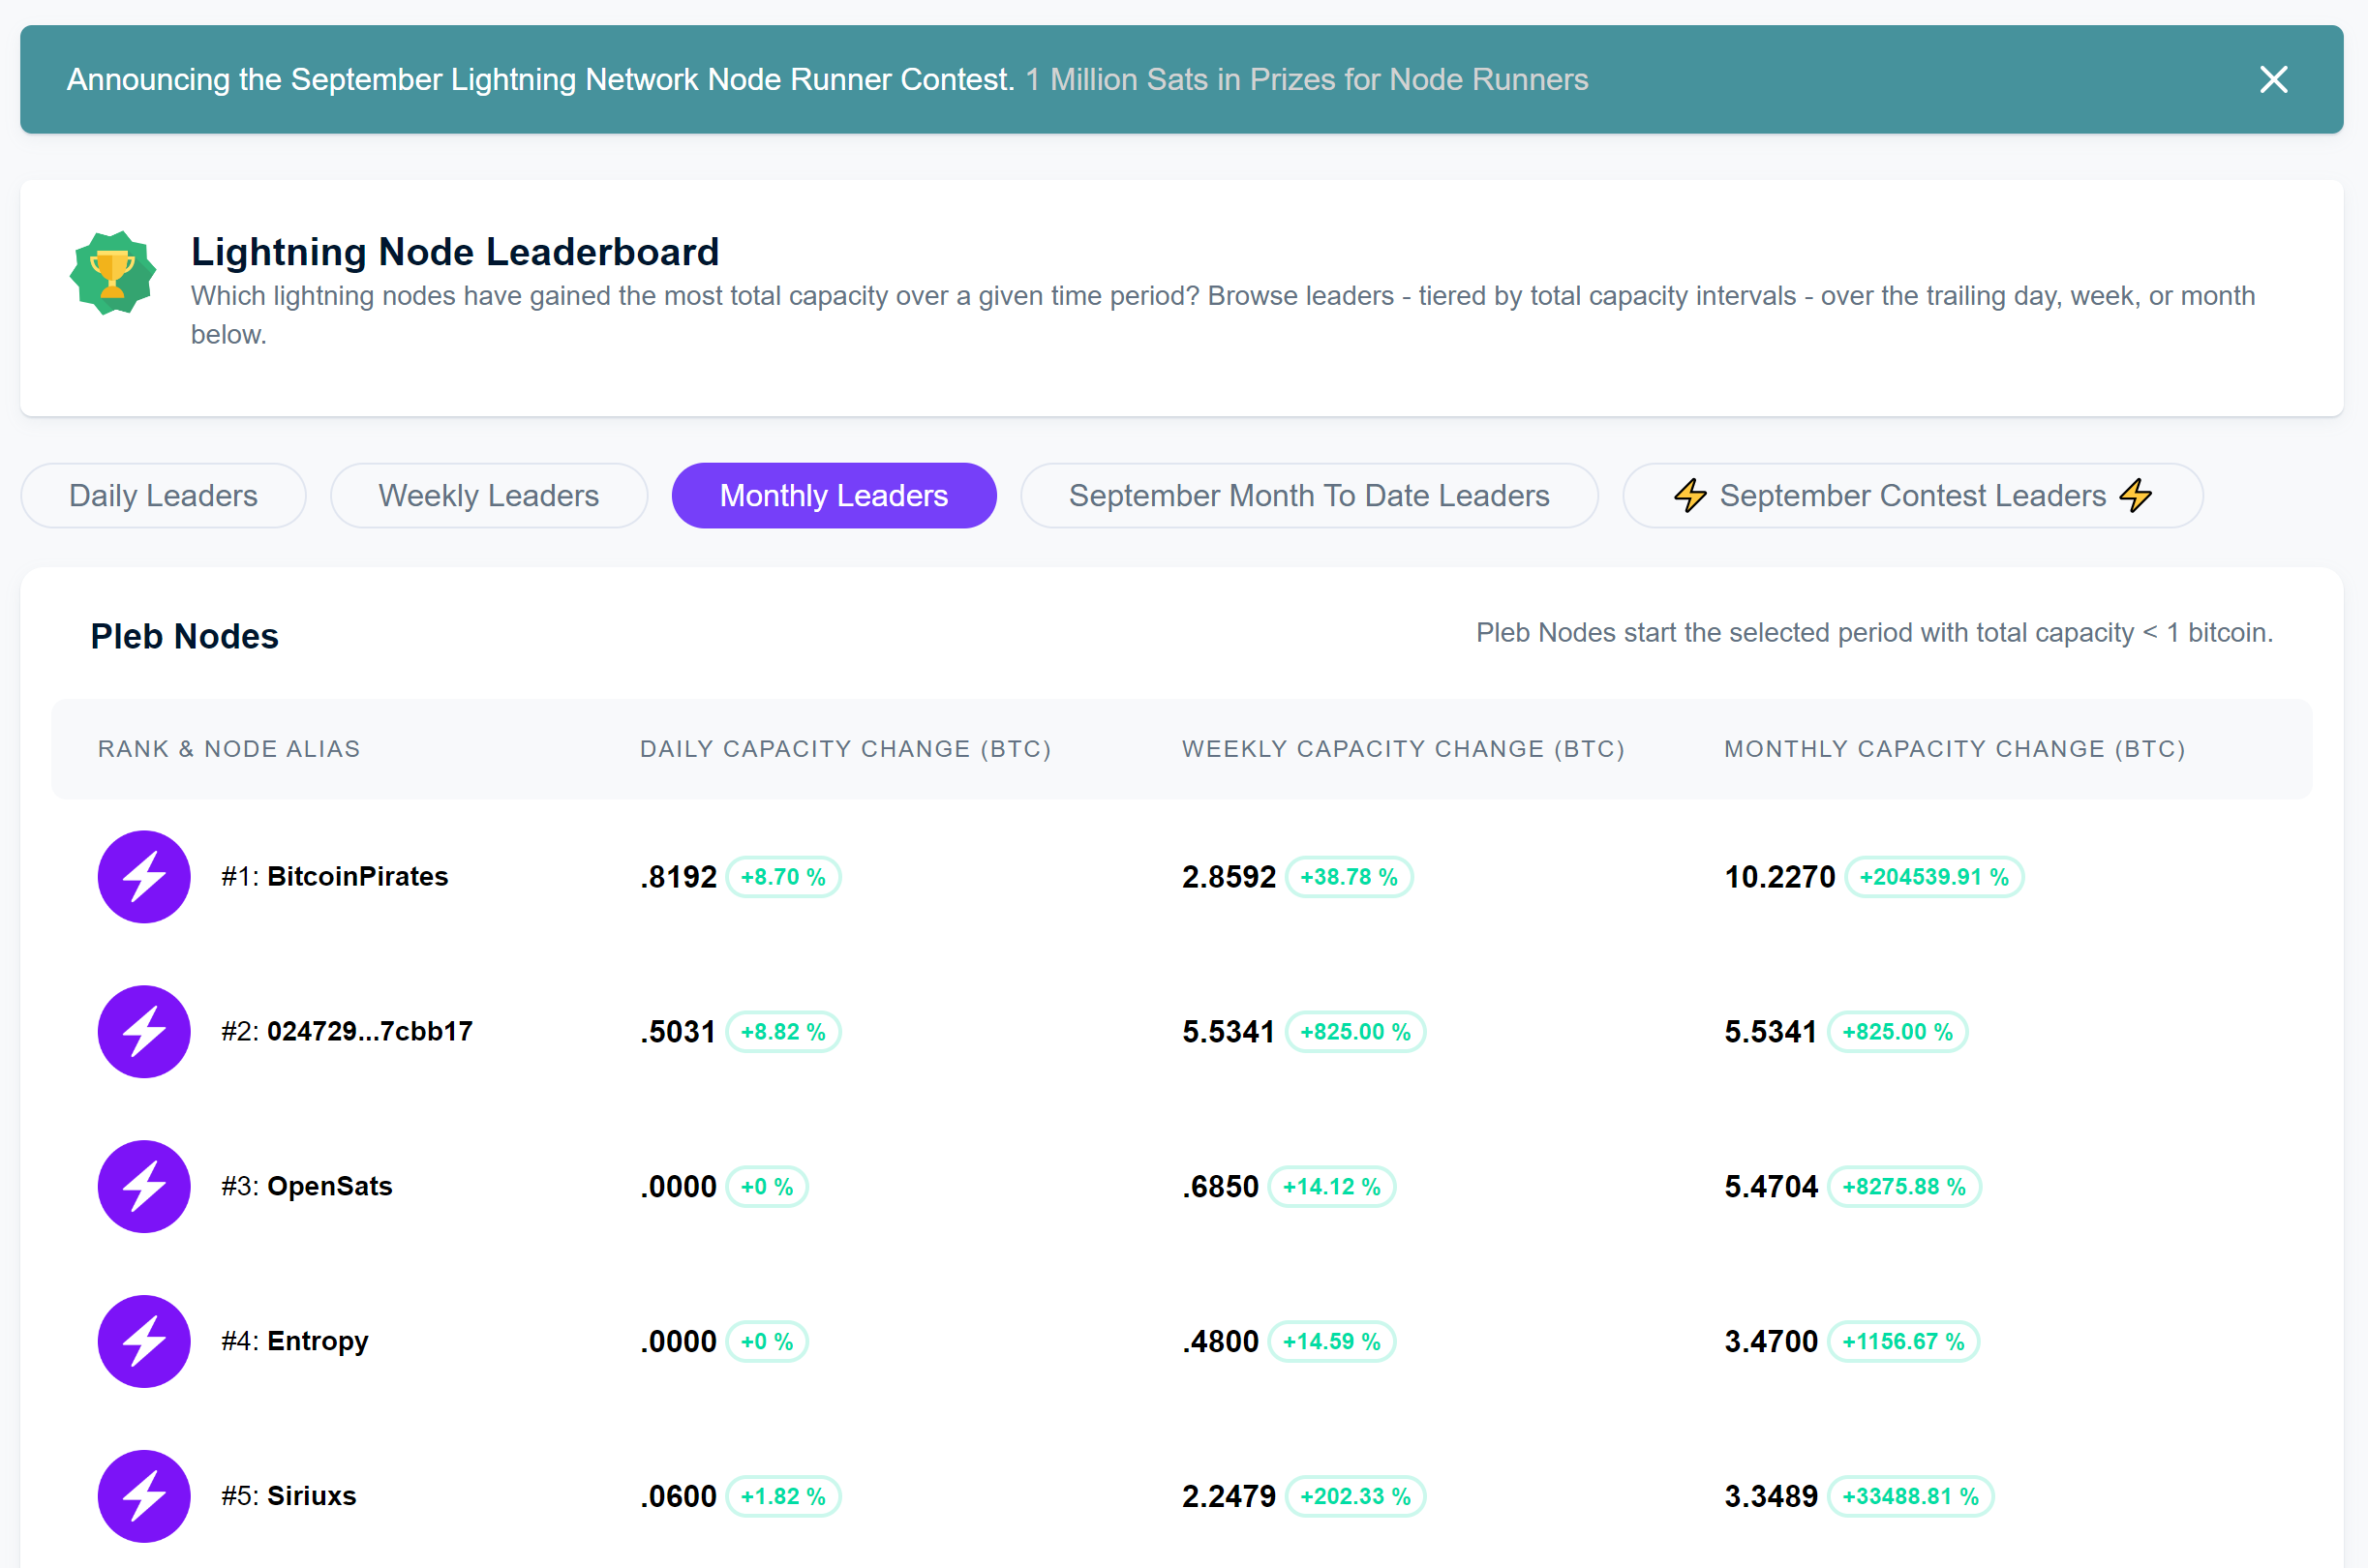
The September Node Runner Contest with 1 Million Sats in Rewards
For any Node Operators, Exponential Layers is offering 1 Million Sats in rewards for top nodes in September. Check out all details of the contest and view the leaderboard below:

What metrics would be helpful for you and your team? What data would you like exported, summarized, or otherwise aggregated?
More details to come soon on this and please get in touch with network data and metrics that would be helpful for you or your team.


Comments ()