
Millennials only want this one thing...
"If it took you one month of riding your bike for 10 hours a day to generate the energy to buy this house in 1987, you would now need to ride your bike for 8 months to buy the same house."

This is a repost of the article we published in Bitcoin Magazine last week:

This beautiful 3 bedroom, 1.5 bath house in Charlotte, NC is a millennial dream. Complete with a backyard (for a dog) and a porch for enjoying a coffee (purchased at the store), it is in a prime neighborhood just down the street from a brunch spot with an all day avocado toast special. And for just $730,000, it can be all yours.

We all recognize this house is expensive. A $4,000 monthly payment, even after putting $150,000 down, would represent nearly 70% of the median US household income. And this house is 1.7x higher than the US median home price of $440k.
Why is this House So Expensive?
The house was built in 1938, and its latest available records show its selling history, the earliest sale being in 1987 for $88,500.
This jump from $88,500 to $730,000 is a 724% increase over 35 years, and reflects a CAGR of 6.2%. That’s quite an increase. But, over the same time the S&P 500 is up 465% at a CAGR of 5.1%, so is it really that big of a jump in comparison?
What about GDP, the go-to for measuring economic output? GDP is up from $4.7 Trillion to $24.8 Trillion in nominal terms, another triple digit increase of 427% over 35 years.
So everything is up…it makes sense, right?
Charlotte has grown in population from 424,000 to 2.2 million over this time period (5% CAGR) and this house is in a great neighborhood, so supply and demand? And our economy is more productive, so the rise in price is inevitable?
All of this checks out on paper, except for one metric… energy.
US Energy Consumption in 1987 was 21,056 TWh of energy, which adjusted for population at the time represents ~87,000 kWh per person. Of this energy consumption, electricity usage was ~11,500 kWh per capita.
Compare that to today - the latest figures in 2022 for the United States show per capita energy consumption of 76,632 kWh, with a slight increase in the amount consumed as electricity at 12,466 kWh per person.
For all of the talk of “walking uphill both ways” in previous generations…it actually turns out that more energy was consumed per capita 35 years ago than it is today in the US.
The Energy Breakdown
There are a number of forms for how energy (and then electricity) is created (quick cheat sheet and refresher here).
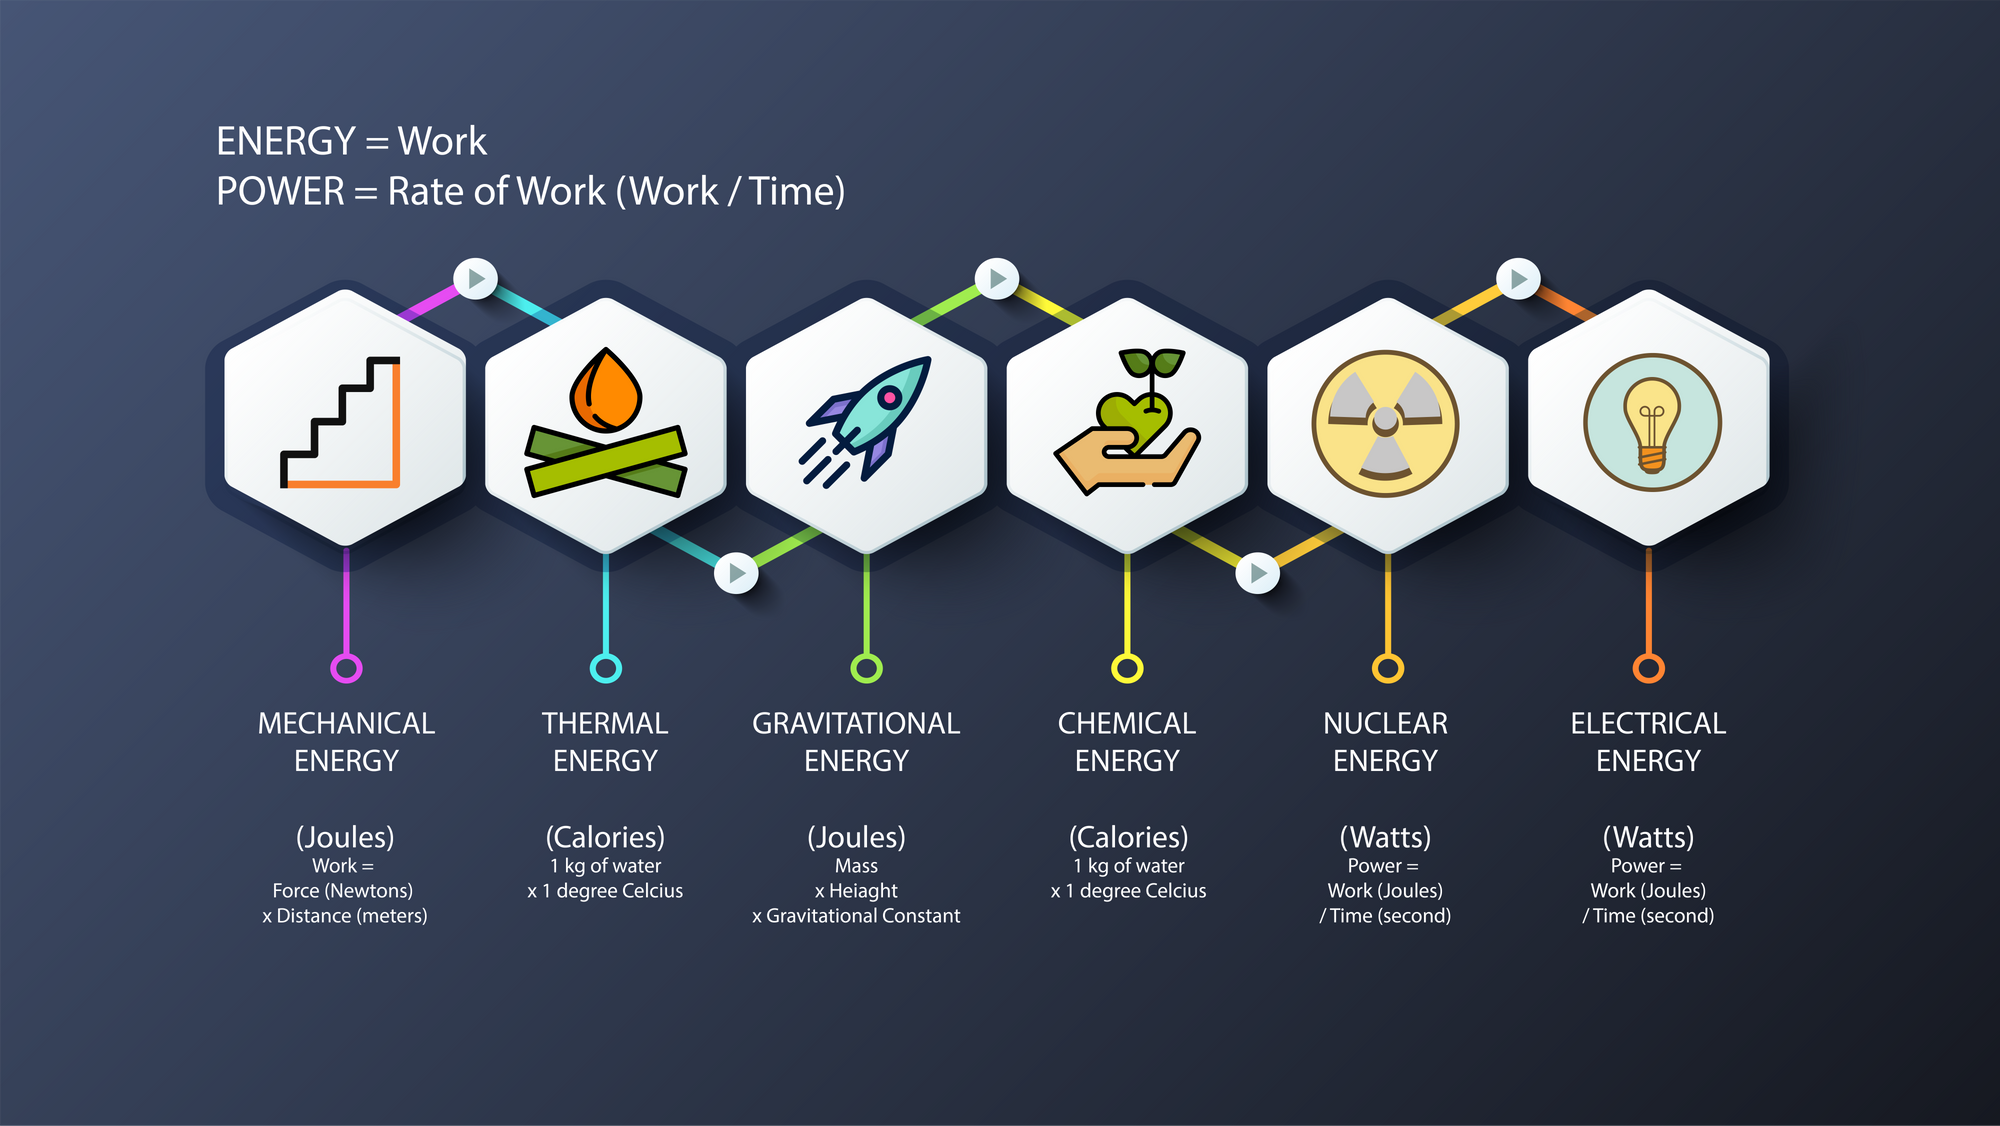
If you ride a bike at a reasonable pace, you will generate 100 Watts - keep this up for 10 hours and you will have generated one kWh worth of energy. A load of laundry done with a washer and a dryer will consume about ~6 kWh of energy.
If we ignore the monetary denomination of housing prices and just look at the US Economy as as the output and consumption of energy, we now consume *less* per capita than we did in 1987.
But instead, as we saw in USD prices, the house is 8x as expensive, while energy consumption is flat. By this logic, if it took you one month of riding your bike for 10 hours a day to generate the energy to buy the house in 1987, you would now need to ride your bike for 8 months to buy the same house. 8 times as much energy for the same product? Better get out that Peloton subscription.

Okay, but this is a cherry picked example of one house in a growing city - it has probably been renovated many times and is worth the extra work, especially considering Charlotte’s population and job growth...
Let’s zoom out and look at another example.
The Texas A&M Real Estate Center publishes aggregated rural land prices. From their chart, we can see that an acre of land in Texas (aggregated) in 1987 was $487. That same land in 2021 is now nearly $4,000/acre (an 8x increase over 35 years).
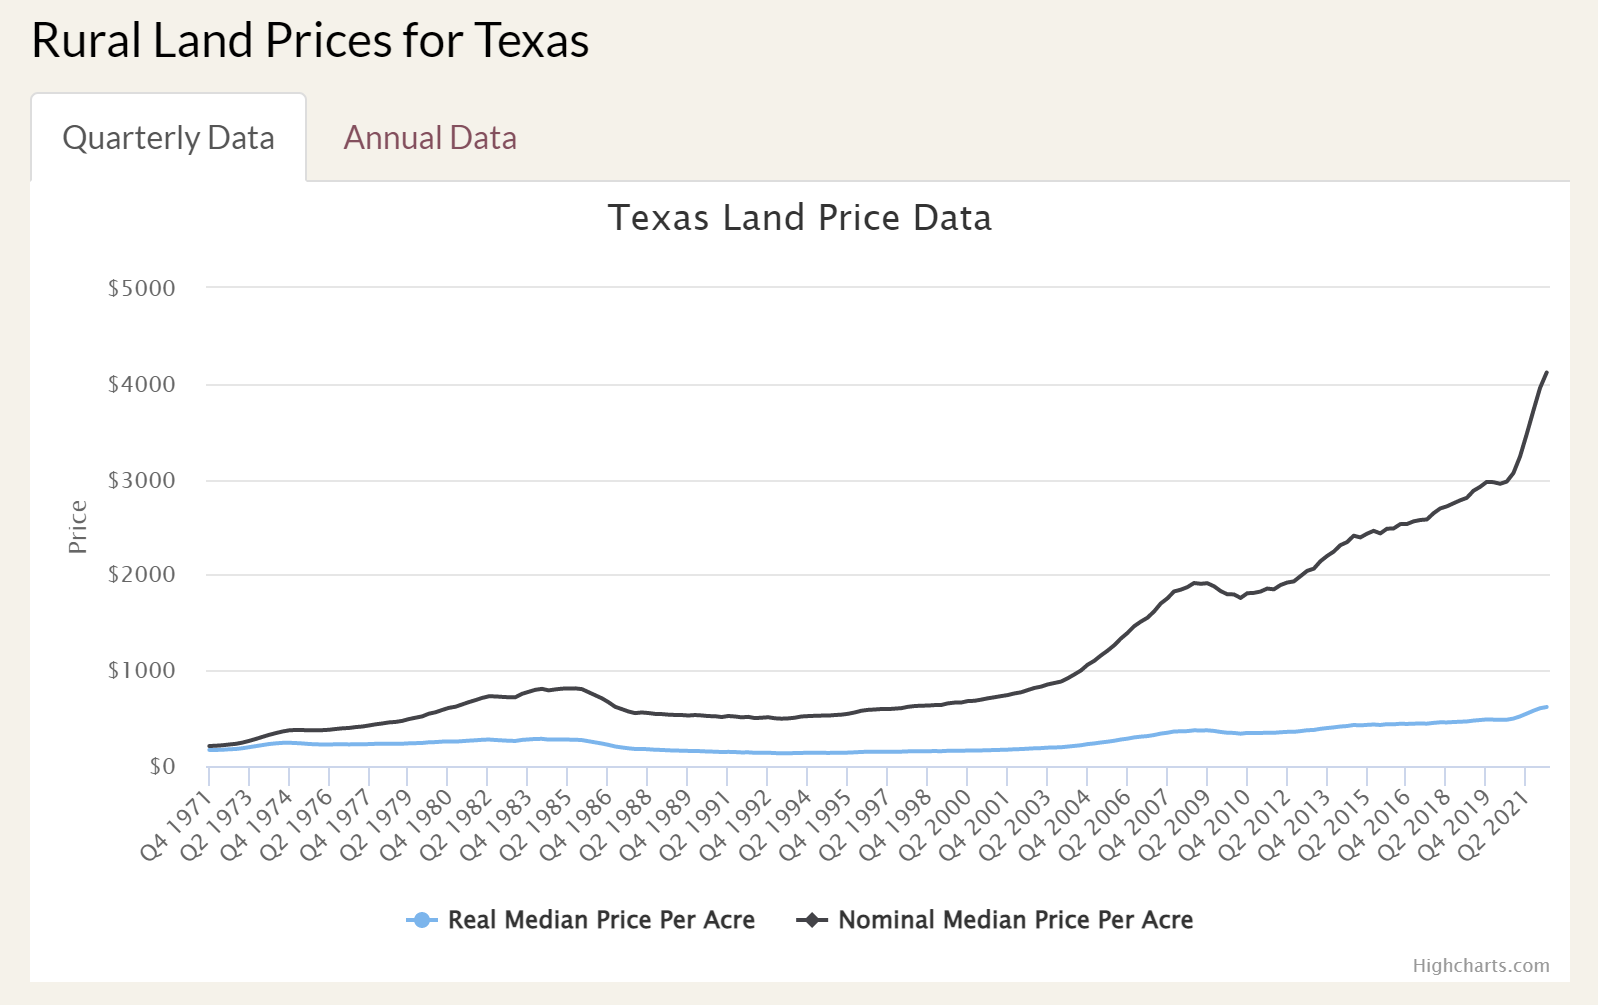
An acre of land, with no improvements, in the middle of nowhere, now requires 8 times as much energy output to purchase!? Land can improve in value with higher population, utility (purposes of farming or hunting), or lower tax rates/some kind of subsidized incentives. But aggregated out like this… at a 362% price increase after adjusting for US population growth? Texas forever, but something doesn’t add up here…

Is Energy The Correct Metric?
The idea of an energy based money is nothing new. Henry Ford was an early proponent of energy as currency, and as many Bitcoiners and redditors have pointed out - he was also a believer in reincarnation (H.F. anyone? via /r crypto_grandma). The idea of a money denominated in energy terms (kWh for example) held great promise for getting us out of the fiat system.
We all recognize the concept of energy intuitively. We either work longer hours, or we focus efforts or use better tools to leverage our output. And the abstractions simply go on up - the corporate world is full of IRR analyses, resource staffing, budgets, and timelines. Earnings reports and financial statements offer the scorecard to the market, who over time weeds out businesses that do not generate economic value.
Our system of capitalism has worked quite well. Thanks to the incredible ingenuity, output, and work of everyone in the world, we now have lower prices in so many things (and this despite inflation!)
The ENIAC in 1956 weighed 27 tons, consumed 150 kW, and ran ~100k operations per second. And cost todays equivalent of $6 Million. Today, a new Macbook weighs 3.5lbs, consumes ~40 Watts, and cranks out 3.2 billion operations per second - all for $2,000.
Airliners have increased their fuel efficiency at a compound rate of 1.3% between 1968 and 2014.
So in many cases, we are getting much more efficient with all of our energy consumption, so things should be getting even more inexpensive?
What’s the Problem?
To be able to have a rich life and so many improvements while using the same energy per capita is a benefit to all us. But how that economic value is measured, propped up, or changed is susceptible to changing rules.
If we have gotten more efficient with our energy and have better technology, how is it that a piece of rural land costs 8x more? This is where the Federal Reserve's expanding money supply and creation efforts come into play. For all of the talk about "transitory inflation", the Fed (and banks) have managed to expand the M2 money supply 677% over the past 35 years.
So while our nominal GDP is up 427%, it hasn’t outpaced money supply growth. And we have already seen that energy consumption per capita is flat over 35 years.
The problem here is what we all can tangibly feel...the output of our work denominated by the energy we put in is worth significantly less over time.
When we as individuals or corporations are unable to preserve the efforts of our energy output, we must continually find ways to preserve our purchasing power (through assets like land, commodities, and businesses in the form of stocks). And if the pace at which stored energy degrades is faster than innovation and output, we have problems. Physical limits come into play - we can print all the money in the world, but we can't fake energy production and consumption.
And yes, our energy may be consumed more efficiently - as evidenced by the airplane requiring 45% less fuel for the same trip - thus providing more value to society. But if our society has been so efficient, why has debt to GDP risen from 47% in 1987 to 125% today? How is it that we have needed to borrow against the future so much in an environment of increased productivity? At some point this all breaks.
What Breaks?
Unlike with fiat (or any proof-of-stake altcoins), you cannot fake energy creation. Doing more work in the past does not magically create new work in the future. However the cover up in fiat money printing, combined with every administration's propensity to spend has left us in debt.
Supposedly this is fine, because we can always print our way out of debt. But can we?
Yikes... https://t.co/E90Lidl8p7
— Senator Cynthia Lummis (@SenLummis) September 10, 2021
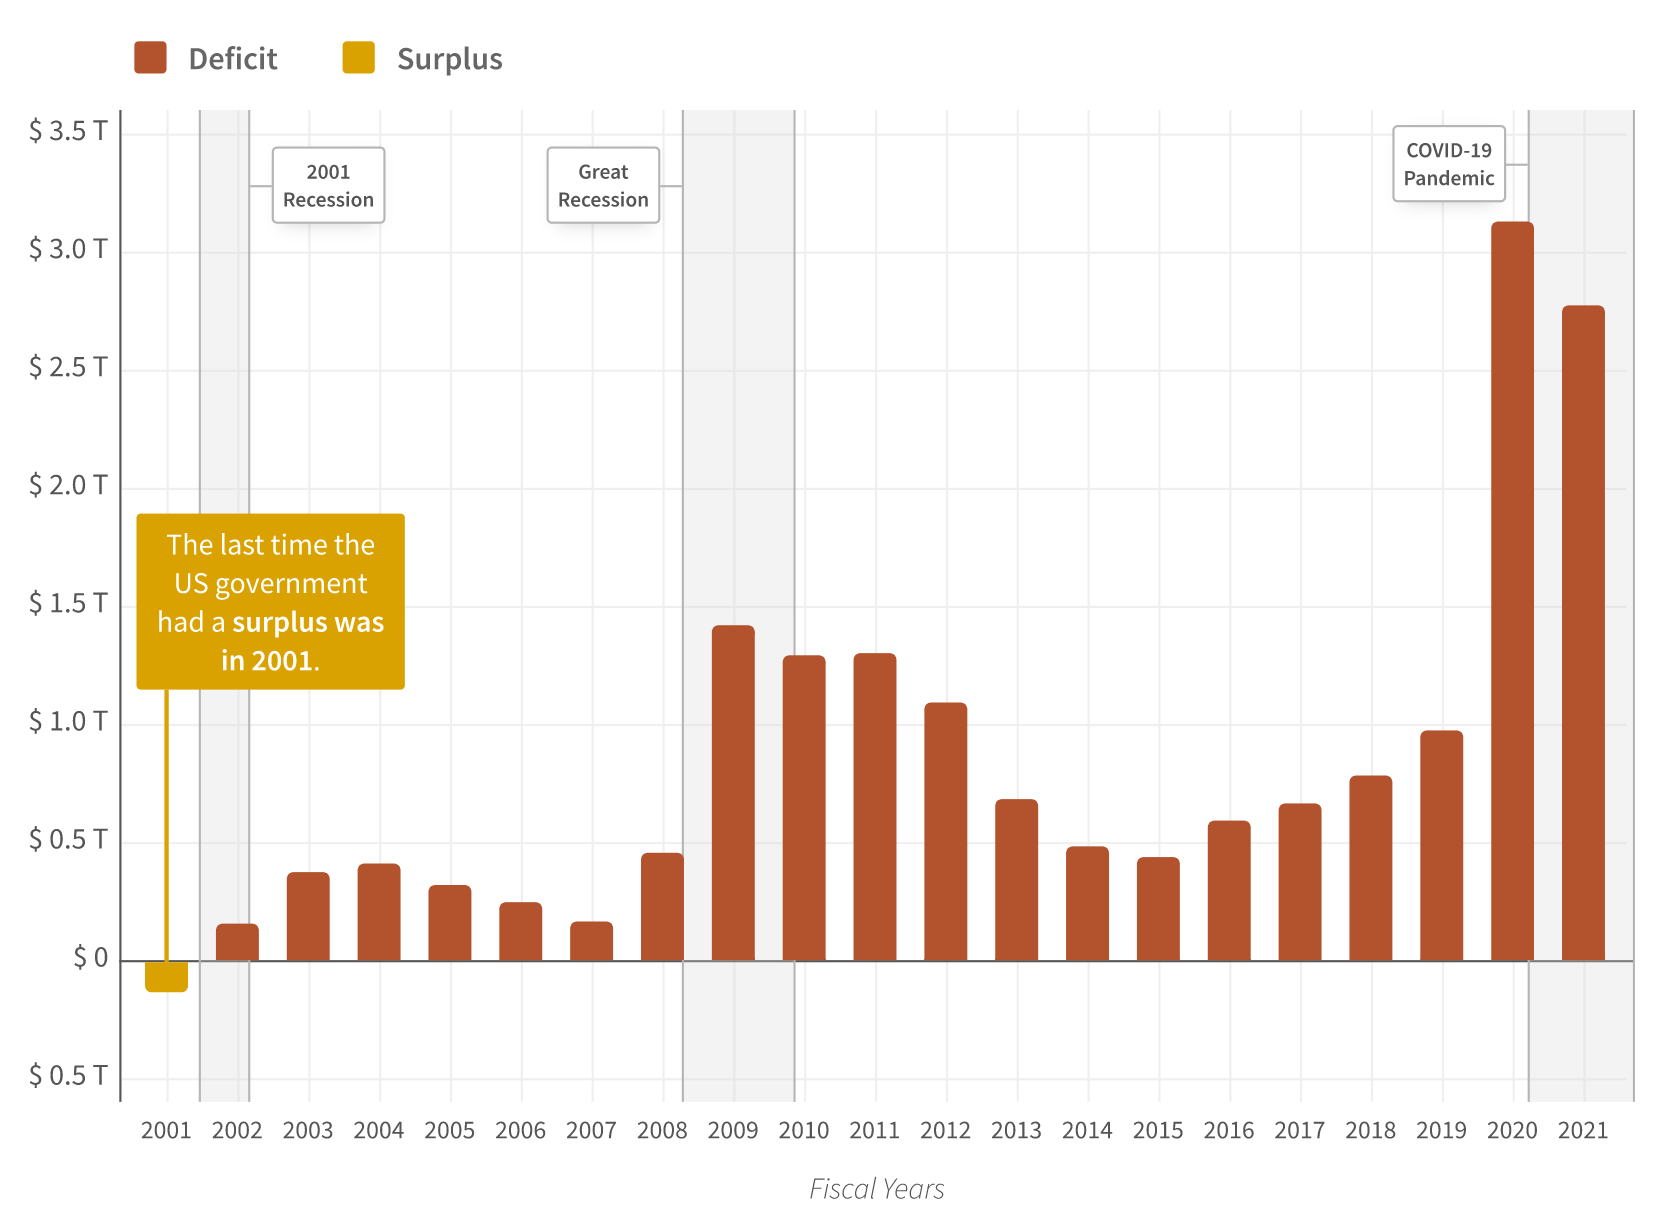
In 2021, the Federal Government brought in $4.05 Trillion in revenue on GDP of $22.4 Trillion. It spent $6.82 Trillion. The pandemic payments made up $570 Billion on top of other category staples such as social security ($1.1 Trillion), Health ($797 Billion), and Defense ($755 Billion). Interest paid by the government was $352 Billion - 5% of total spending (in a pandemic year).
Over time, the government has spent more as a percent of GDP - 32% in 1987 compared to 55% at the height of the pandemic, and now to 34% in 2022 - even after capturing the value hidden in inflation all these years!
In attempts to quell record inflation (9.1% in the latest report), the Fed hiked interest rates to 2.5% in July - an increase of 75 basis points (.75%).
While this may "slow" the economy, it has two negative effects on being able to balance the budget. With a slower economy, they have a lower tax revenue to draw from. The latest 1.75% interest rate increase also adds another ~$130 Billion in interest expense to a budget that already can't be balanced. This comes in the form of added expense on debt rollover, and this great article from Allan Sloan walks through an estimated calculation.
Using his rollover debt totals of ~$7.1 Billion, every 100 basis point increase in the federal funds rate adds another $70 Billion to required government spending. If rates ever get up to a ~5% range, that puts interest expense (on just current debt) at some ~$500 Billion.. more than transportation, education, training, employment, and social services combined.
The Fed can also continue their attempts for QT, but this has the same problem - higher interest rates (and interest expense), and a presumably reduced tax base given economic slowdown.
The last remaining option would be to cut federal spending or increase taxes. And with names like the "Inflation Reduction Act", we already see the government masking increased taxation attempts. Other "hidden" taxation attempts will likely come - increasing the social security benefits age, adding additional taxes for "wealthy" people withdrawing from their 401K or IRA, putting in carbon taxes under the guise of "ESG". Things will need to be creative to offset the competing incentives of a surplus and (re)election.
At some point, this model breaks. We cannot cut energy production and consumption, cut interest rates to encourage growth, and run continued deficits - the numbers don't add up and eventually no one - individuals, companies, or governments, can fake the energy output required to keep pace. We have seen a number of debt ceiling showdowns over the past decade, but this time seems different, especially with 25%+ of the world living in countries with hyperinflation.
25.5%+ of the world population now suffers from 10%+ #inflation. (+2.5% since I last made this map in May 2022)
— Sam Wouters (@SDWouters) July 31, 2022
Another 47%+ of the population has between 5-10% inflation. (+4% since May 2022)
Some context on inflation below 🧵[11] pic.twitter.com/7YsFOMb9WA
What's Next?
Money is just a tool for valuing goods and services over time (with key properties). It doesn’t create “yield” by itself. Only productive assets - which are energy accretive in some way - can do this.
When it all breaks down, whoever holds the productive assets can determine the role of money, provided they have the resources and means to enforce and defend the rules.
But... as all of you are well aware, we finally have an alternative option. And instead of coming top down, backed by military enforcement, Bitcoin is adopted bottom up - in the very order that its properties become beneficial to the people and companies providing economic value.
And all we want as millennials is a way to preserve our work, energy, and purchasing power. And have a good avocado toast while we ride our pelotons :)

How Bitcoin adoption plays out will be interesting and exciting to watch. Bitcoin is already used worldwide, with a $440 Billion market cap, settling some ~$60 Trillion.
And now with the Lightning Network, Bitcoin can be sent peer-to-peer instantaneously, with no central authority. July saw the highest month on record for Lightning Network capacity, and every metric is up and to the right for providing a Bitcoin payment layer that offers continued utility and helps clear the "medium of exchange" hurdle present in the fiat system.
Defining success metrics relies on a whole host of factors, and at Exponential Layers you can take a look at preliminary Lightning Network metrics that give insight into network growth (among other data), as Lightning moves to take the role of Visa's $10.4 Trillion yearly payment volume.

Comments ()